


Augmented Reality UI for Lunar and Martian Energy Operations
‘Holograms’ in space are cool. The goal of this article is to get people to make them with me. I’ll present the idea of using the same technology to explore mars and solve energy problems on earth at a FiO + LS optics event in Washington DC this week. Before I do, I want to talk about why I call ‘holograms’ a more proper name: stereograms and touch briefly on their origin.
// What is in a name?
‘Holograms’ don’t mean what people think they mean. Merriam Webster defines a hologram as, “a three-dimensional image reproduced from a pattern of interference produced by a split coherent beam of radiation”. To see something more like a Hologram check out some work done at BYU. According to dictionary.com, a stereogram, “is two almost identical pictures, or one special picture, that when viewed through special glasses or a stereoscope form a single three-dimensional image”. So most if not all of the technologies hitting the market since 2012 and likely extending out into the next 5 years will be stereography.
Often I hear people say we should stick to familiar terms when discussing augmented, virtual, or mixed reality. Why introduce new terms? My point exactly. Augmented Reality was a term coined by Thomas Caudell coming out of University of New Mexico. The concept was fashioned after ‘the Mother of Demos’ by Douglas Englebert in 1968. But we need to look further back than even these titans of research — back in Geneva in the 18th and 19th centuries.
La Stereoscopie exhibit in Geneva states that steroscopic images, which were invented n about 1841, showed depth. A series of images slightly offset one from another and photographed by a camera with two lenses produced double images which, when viewed through an optical apparatus, re-established the impression of volume [1].
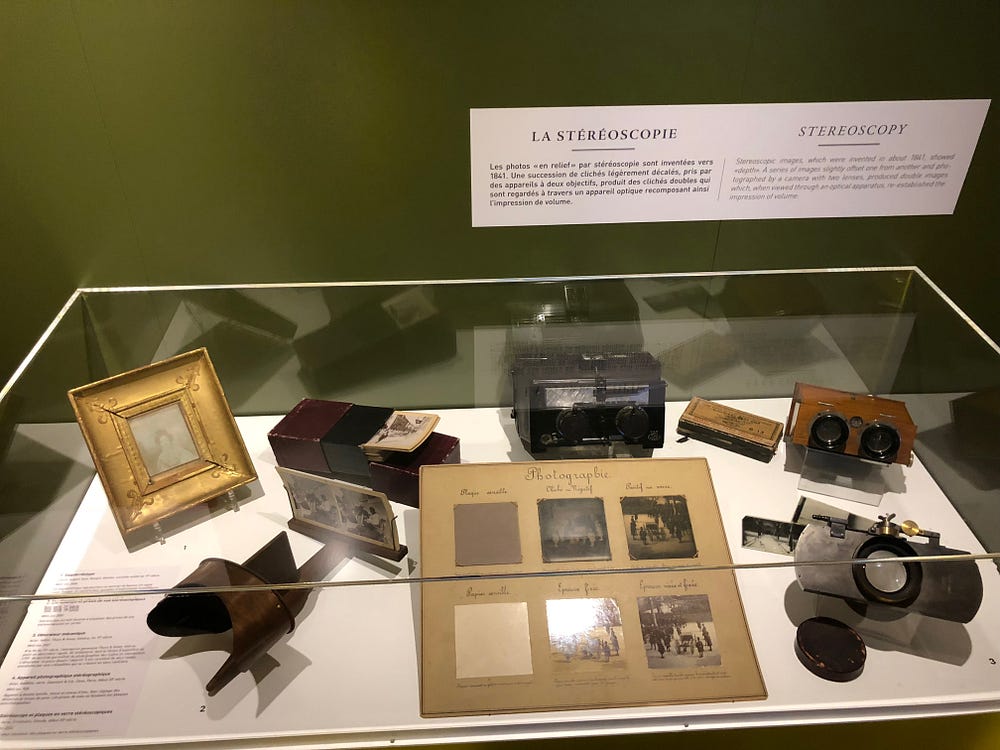
The exhibit displays headsets from the 19th and 20th centuries by makers of the names Louis Bonijol, Thury & Amey, Gaumant & Cie, and Ernemann.
One headset is prominently displayed on the first floor of the museum called Stereographic Apparatus (Appareil stereoscopique) by Fouchault in Geneva around 1920. Birds in three dimensions (‘Des oiseaux en trois deminesions’).


I’m arguing that the people who get hung up on terminology are likely trying to create a marketing pretense to force the industry to adopt a term that they have employed for years which maximizes their SEO. But virality isn’t always top down. Oftena small group of influential people will just adopt a term from outside a social group that looked to create the tool. Nobody ‘queries the internet’. They google. No one uses ‘augmented reality’. They _____.
So until that term exists, I will use stereograms because if I’m sitting around with cocktails with some folks who start talking about what they saw at the Computer History Museum in Silicon Valley and reference the sword of Damocles — I am going to challenge them to look further back into history if that is the heuristic by which they use to create names for nascent technology.
// How do stereograms help the world?
I do R&D for the use of augmented reality in electric power applications, so I just needed to find an overlap between the needs of a utility worker, astronaut, and headset.

How would augmented reality directly benefit humanity instead of just a few dozen folks in a space station and ground control who more or less seem to have their head in the clouds? There may be potential impact to modernize the workforce to become more effective and efficient. According to a utility in a recent EPRI pilot study, an augmented reality (AR) task flow could reduce labor and logistics costs by shortening restoration times when power systems are damaged and potentially save $8,250,000 per disaster [2] which would decrease power costs for the public. One key finding was that the combination of AR with voice recognition enabled field workers to capture notes, automatically transcribe them, and transmit them over a Bluetooth & WiFi connection to a server which could be used to accelerated replacement parts dispatch.
In the simulation, the AR task was completed in half the time with one worker when compared to the paper method using two people. It may be that there were too few participants in the study to make statistically significant conclusions but the results may warrant further investigation. To see more, read a publicly available report I wrote on the overlap for numerous industries for spatial and reality computing [3].
// Cultivating two biospheres with one stereogram.
Alright. We have established that ‘stereograms’ may help a lot of people through:
- Giving them useful tools
- Getting power restored and in a more cost effective way
If this is true, it follows that leveraging some of the brightest minds on the planet to push sterographic science into a new frontier just makes sense for humanity. But how do we convince these brainy folks at NASA and other aerospace organizations to agree? I thought you would never ask! We would cross pollinate to investigate stereograms can help solve their problems, too. One problem we can solve is making space research more cost effective. One way to make it more cost effective is to reduce the weight of the research equipment and tools. One way to reduce weight is to decrease the amount of tools is to analyze and improve how use tools in space.
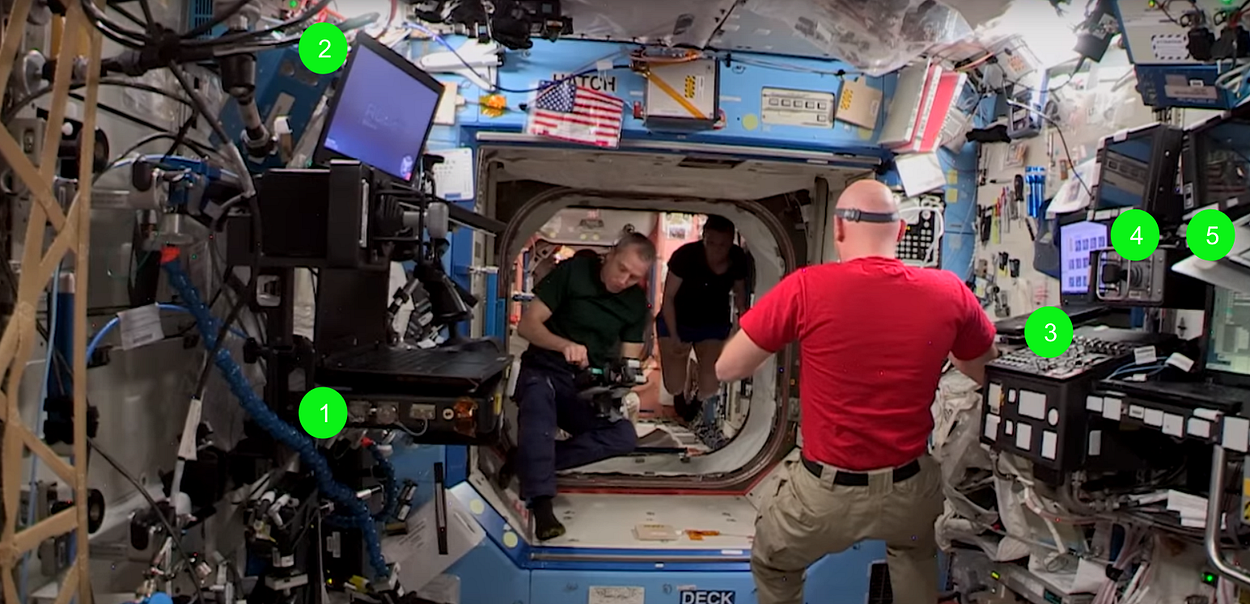
Which tool? Computers! Traditional laptops offer fixed screen real estate that is statically situated in areas of the capsule. According to a Bloomberg report citing FAA data, private launch of 1 pound into space costs $6078 to launch one pound into space on a private mission (not government) using SpaceX, in the most optimal scenario. The cost is nearly double that using United Launch Alliance because government missions will typically have more stringent requirements which can increase cost.
- The average laptop weight 5 pounds.
- 3 laptops can be seen along with 2 bulky screens — as numbered by 1–5 green circles in the image entitled ‘Space to Ground’
- 2 pounds can be the assumed weight for the remaining screen in the picture.
- 3 pounds then can be the total weight for the each and the supporting columns and cables weigt
- 23 pounds is the conservative estimation for this Information Communication Technology setup.
- $139,794 would be a very conservative cost estimation — Assuming SpaceX is contracted to launch this equipment.
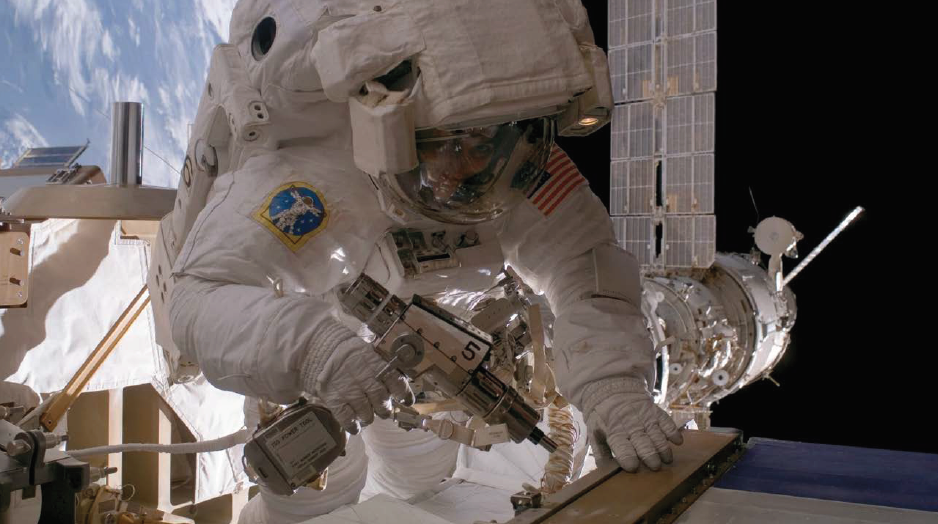
A stereographic setup would require a 0.92 lb meta headset, 5 pound computer, 2.43 pound graphics card, and wireless adapter. Alternatively, a hololens would need none of these and weights 1.27 pounds but the field of view would decrease along with visual fidelity. Both are great — but it depends on the use case. If a hybrid system were to be used, it might cost approximately $68,000 to launch 1 tethered rig and 3 headsets. Would this cost justify spending more on mobile stereographic (augmented reality) tools? Perhaps, if the cost were shared by more companies who had similar needs to the astronauts.
From a human factors point of view, an astronaut could take 1 headset through out each capsule of an International Space Station or other vehicle in orbit around Mars or the Moon, assuming it can interface with each computational system, database, etc.
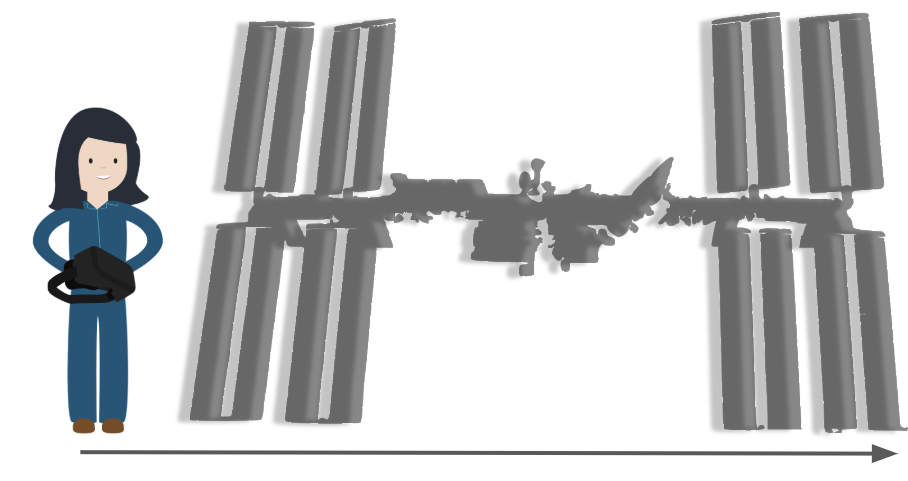
In figure X, we can see how an astronaut might move capsule section to capsule section on the International Space Station. What kind of stuff are they doing up there? All sorts! How great would it be if one headset could interact with all the systems and other headsets that people are working on?
// So stereograms in space work on earth too?
Yeah. The figure below is a terribly simple technical architecture — and perhaps errant — so my feelings won’t be hurt if you see a mistake. But essentially, here is what happens:
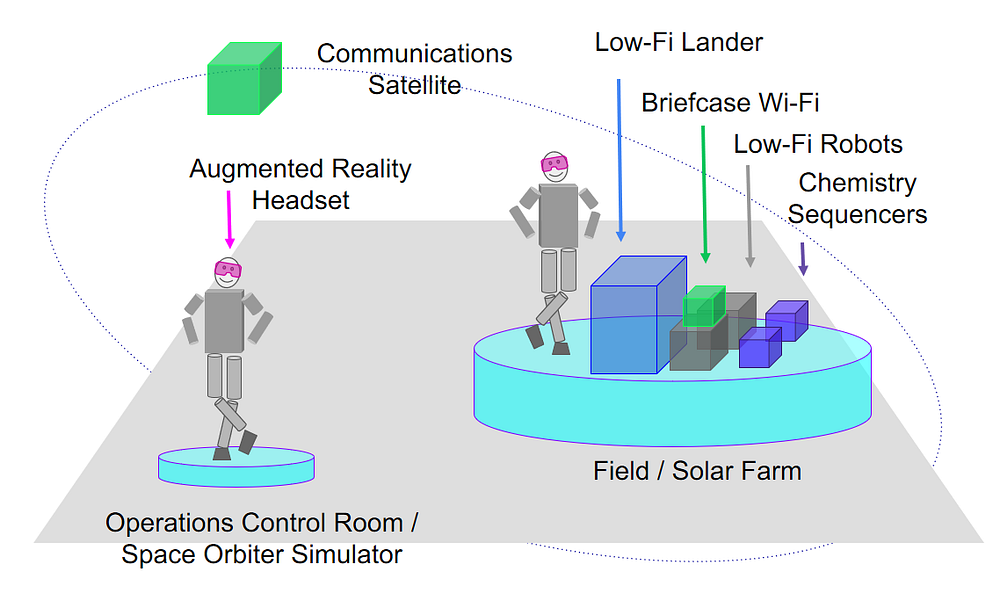
- A worker is out in the field. They need to navigate and learn how to perform a procedure. They select what they need and that sends a query to a database.
- The system returns a file size and time duration for download. This is mapped to cost to create a heuristic if the worker will make the download using a satellite enabled mobile hotspot. Price is usually 1 GB for $500 depending on which plan you use.
- The headset is connected to the entire smart grid unit and can suggest other tasks to the worker while they wait for training and procedure download. This optimizes asynchronous communication not only on earth but even more so in the deep space gateway, lunar missions, or mars.
- The worker communicates with ground control or an utility operations center regarding mission critical steps.
- The worker has control of machines and systems around them in a distributed architecture. It can work in space or on earth.
// How might stereos help a lot of people?
In the figure entitled ‘Duke Solar Stereograms’ an entirely new type of interface emerges than the arrangement we see on the International Space Station. On ISS, we see a static system. It is static because most of the machines are in a fixed place and presumably correspond to only a few types of work. This paradigm of computing is non-spatial because each room evokes a set of information and procedures that can be enacted but does not allow quick transfer or categorical thinking because of the rigid mapping between visual cues and what the computational system in that room does. These procedures are constrained to file systems buried in a hierarchical list. But with the the application that Duke Energy made the person wearing the headset is able to move to any place in a work site to conduct work. They don’t have to be next to the solar panels to look at 3D models of energy storage systems and their hands are free. Obviously, a computer in one portion of the ISS could have data analysis and file systems available in other areas but if the station is already physically taken — then where do they put the laptop? What if looking at the actual experiment helps them think? In the ISS paradigm, the computer holds a world of information. In the Duke energy application, the world of information is all around the user. The visual provided has been edited to include an interface screen that wasn’t used simultaneously in the video but could be if the engineer programs it that way. The following actions can be taken with the application, as denoted by green dots.
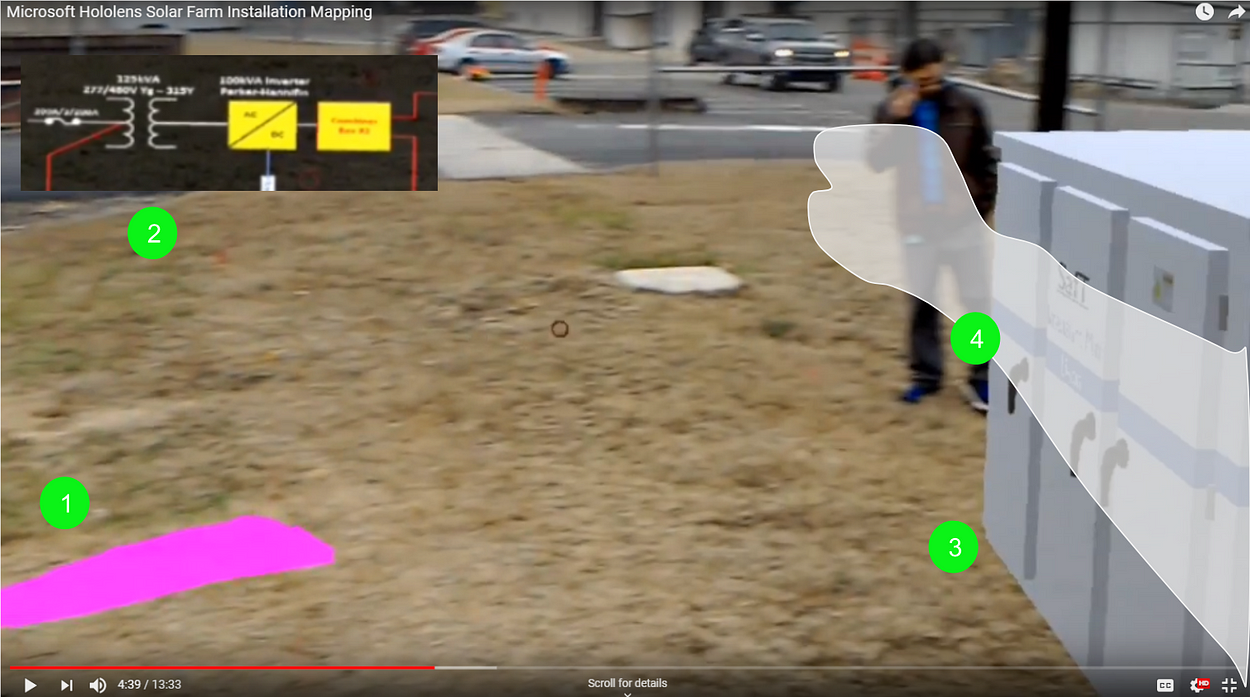
- Simulate potential scenarios such as safety issues like fluid spills or leaks.
- View schematics that are specific to a 3D model they are considering using or an actual type of electrical asset that can be recognized with computer vision.
- Place 3D models of simulated electrical assets and share those plans with people both on site and in other remote areas.
- Perceptually touch the 3D models.
// How legitimate is spatial computing in industrial settings?
Augmented reality was only evaluated in small scales in both the Duke Energy Solar Panel application and the application in the EPRI study. Thus far, the scientific community can acknowledge excitement over the potential of the prototypes along with experimental speculation regarding how they might impact humanity but without more investigation, it can’t be objectively determined that the technology should be deployed at a large scale. It would be very meaningful both to industries investigating holographic technology and hardware companies and organizations specializing in photonics research to know more about what problems need to be built and features created for man machine interfaces.
A large scale collaboration between an aerospace organization, electric power utility, and telecommunications organization might enable a summative prototyping and subsequent measurement of the effectiveness of the supporting processes, tools, and standards. These could revolutionize information communication technology by accelerating man-machine operations; training workers in minutes and days instead of months and years, thereby potentially decreasing the cost of space flight and energy for humanity. Or it could help articulate why some use cases wouldn’t be good for the technology and help direct advances where research is needed.
// What would the research look like?
Essentially, research would be done in an analog scenario with a power company in a place that is most like Mars or lunar surfaces, such as Iceland. This accomplishes a couple things:
- It lowers the technical complexity and cost of the research since value could be realized without having to pack instrumentation into lightweight solution. Off the shelf units can be utilized and experimental adaptions can be made during trials.
- It evaluates the needs of utilities and other industries when the meta 2, microsoft hololens, or magic leap outdoors and it would map the technical difficulties of supporting the data intensive stereograms on mobile networks.
- It leverages the brightest engineering minds to solve problems on earth and space at the same time, potentially increasing positive public perception and awareness about the relevancy of space research.
// What would the stereogram application do and what would it look like?
The watercolor and simple shape drawing below attempts to employ sufficient ambiguity in order to help and R&D director at aerospace organizations such as NASA, ESA, Boeing, Lockheed Martin, SpaceX, or Blue Origin to percieve the context of a martian surface. At the same time, an R&D director from an energy or telecommunications organization might see a solar farm in the southwest United States or Western Europe.
Both contexts are remote areas with weak network connectivity that can interface over Bluetooth to a wifi hotspot on a nearby company service truck with satellite access. The droid in the lower right is a whimsical way of conveying that the stereogram headset wearer can update the droid’s missions and even control it remotely if needed. As an aside, the design leverages a spatial interface design principle from Meta Co entitled ‘You are the OS’ which encourages software designers and developers to ‘Use Space as and organizational tool’ rather than nesting a training module in a file structure [4]. The stereographic design theory is posited on a 2005 Neuroscience paper that suggests spatial mapping in the brain can associate to landmarks but then be activated in their absence [4]. This means that the person using the interface would physically observe and associate while looking around them to recall, identify, or mentally attend to information about a solar panel rather serially search look through a list of solar panels to read and attend to the entity. This all may seem like a tangent to prototype but if the time, effort, and resources was spent to statistically evaluate a solution that could be recommended to industry and the scientific community then it may also be worth giving thought to how the brain might be predisposed to optimally function with a human-machine interface where the human is a part of a larger system integrating real time sensor readings and robot telemetry. The spatial interface principles were written by the CEO of Meta, their Chief Neuroscientist, and the author of this paper. They may serve as working hypotheses to expand the knowledge of man for what would and would not work in augmented reality visualizations and system controls.
// ‘Holographic’ Interface Concept Sketches
The following sketches show a progression through an augmented reality interface concept.
Solar Environment Scanning
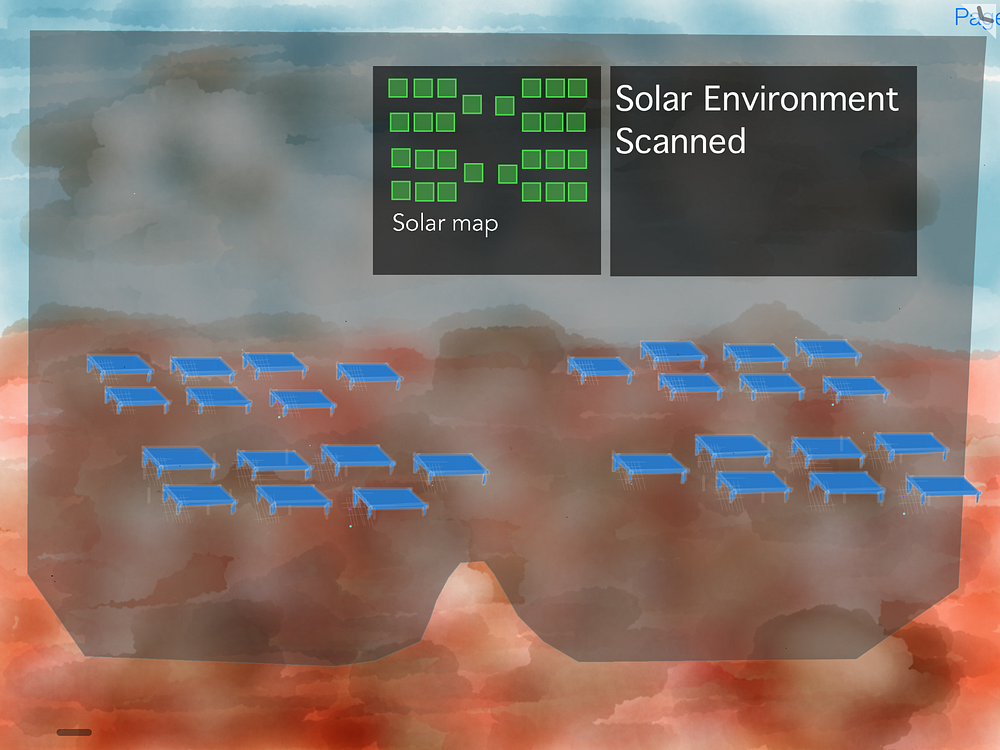
The first sketch shows a spatial map of the surroundings and involves the user first arriving to a sector in the job site to respond to an alert that there is sub optimal performance in the system. At this point, ‘holograms’ can’t appear with respect to the environment because the cameras which use the physical details of the environment to provide a visual camera feed for the graphic processor unit to draw over haven’t started calculating distances respective to cues in the environment yet.
Status Update
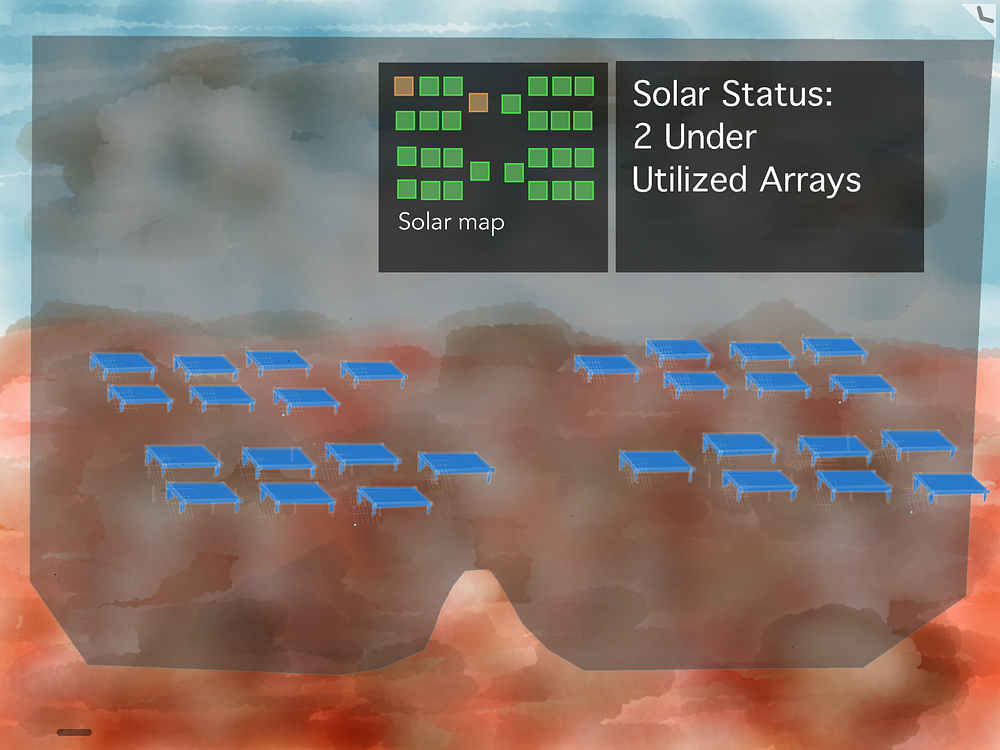
The worker now has now mapped the environment. Analyzed data from operations center regarding solar panel status has been transmitted to the truck and beamed with blue tooth to the headset. Two orange squares indicate sub optimal performance in two solar panel arrays.
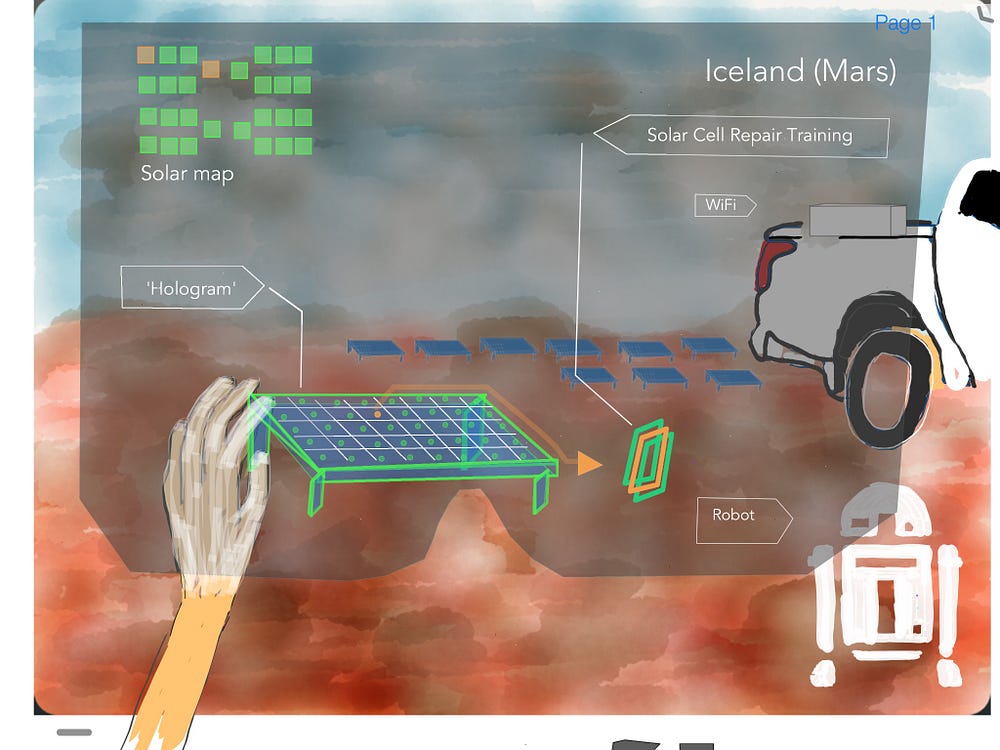
Performing Diagnostics
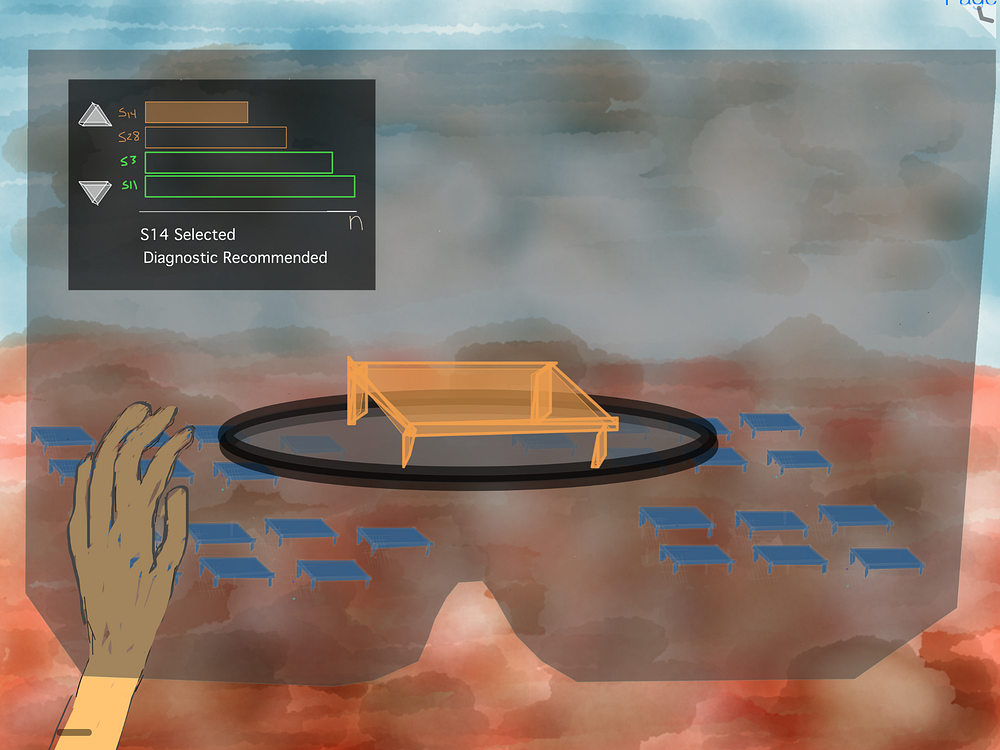
The worker can use the graph to read which solar panels are performing at a lower rate and address them by which ever reason is more important to dispatch control center. Perhaps an analytics application may suggest what action to take but give freedom to the user to choose their own adventure. The worker selects a solar panel to analyze it for which cell is causing and issue. The user can either tap a screen within the stereogram or physically pick up the hologram which is occupying 3 dimensions.
Solar Cell Training
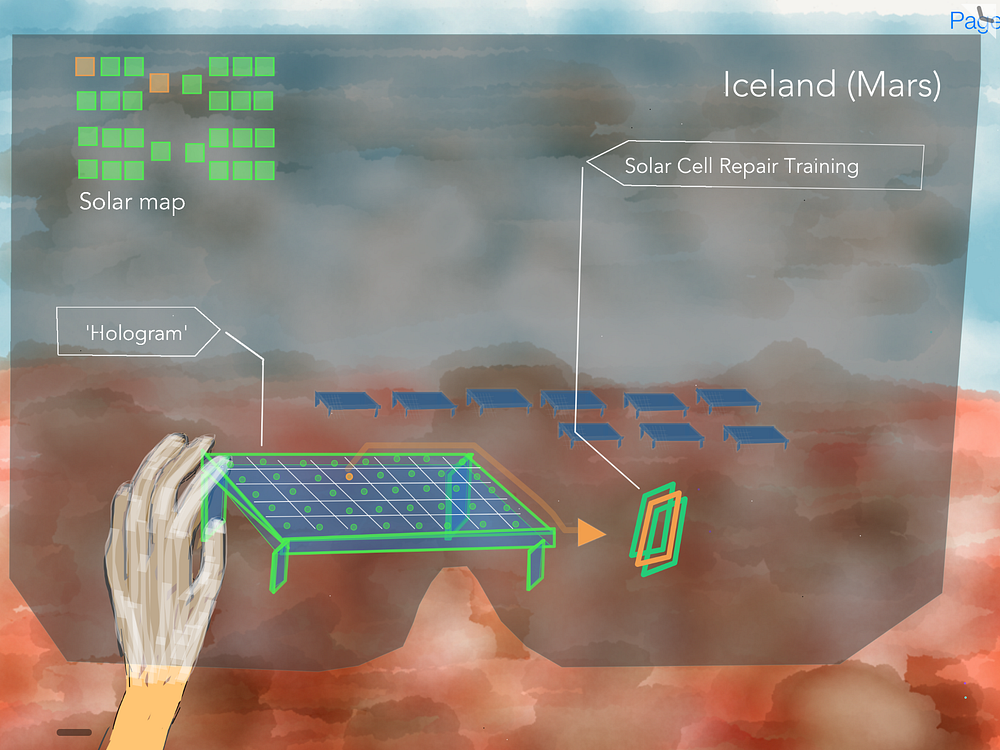
At this point the worker has initiated a solar training application to fix the cell, since they brought repair materials with them. I’m not sure if it is cost effective to fix individual solar cells so perhaps the stereogram shows them how to replace or even the whole section or panel. Generally, this interface shows an information hierarchy about how to learn, practice, and perform a task that they either haven’t done before or at least in a significant amount of time.
// Formative Stereographic Prototypes
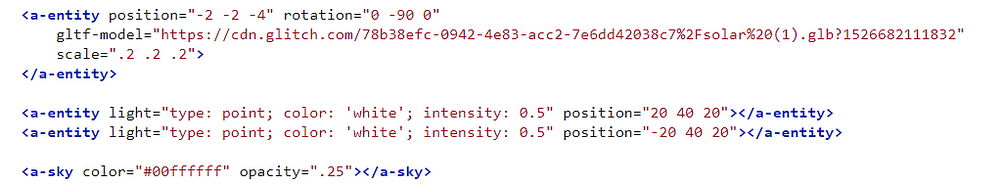
The following mock up is a rough attempt to show how the stereogram headset wearer will function using the way finding user interface element from Stereogram 2 and the barchart from Stereogram 3, except that the actual bar chart was made in 3D to show multiple datadimensions.
- The solar panel was downloaded from turbosquid.
- The materials were added in Blender.
- The 3D model was converted to a glb file format via the Cesium JS gltf converter.
- The gltb model was imported into the glitch asset server using the A-Frame VR library.
- The bar chart was developed by someone else using the d3 library. I just copy pasted the work in. I will look for their name.
The opacity was turned down to ensure the VR would be perceived as AR. Fog was added to induce ambient occlusion.

The human computer interaction here is very primitive and not necessarily by design. Most headsets, including the WebVR library that Meta Co inerfaces their headset to support just has the user actuate (or control) the user interface by head rotation and a cursor called a reticle, a small circle that when placed in a the path of an imaginary and invisible ray drawn from the center of the inter pupillary distance to the object the user wishes to make some state change to (Meta has different interaction principles). For an example, we look at the HoloLens demo discussed earlier from Duke Energy.


The reticle is hardly visible in the image entitled ‘Actual Stereogram’ but the reader may now imagine that by looking at the hologram, they will inadvertently select the 3D bar chart.
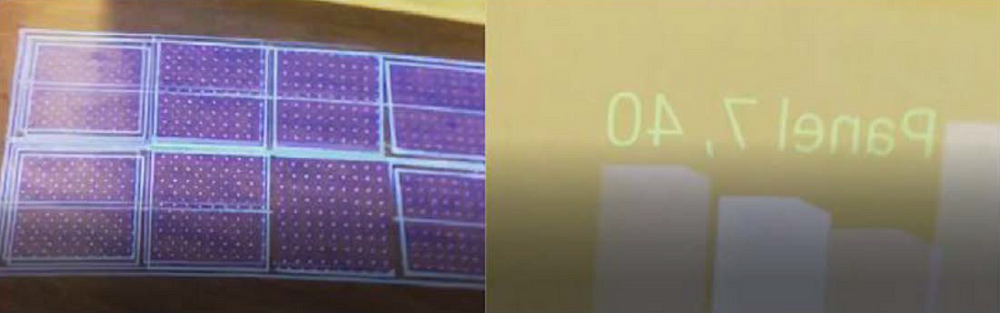
Similarly, when they look at a specific data point bar, they will see a string of text appear that gives the name of the solar panel and the level at which it is operating. This prototype is relatively naive. It did not take much technical expertise or time to produce. This is by design. A formative prototype should generally use the least amount of visual decor and software functionality as needed to convey the idea and purpose to stakeholders and for evaluation by users.
// Formative Evaluation Plan
Two headsets would be taken outside and quickly evaluated at different times of day to vary sunlight. Participants would be anyone who has experience looking at visualized data for a object since there is likely no difference between a specialized worker who performs diagnostics and repairs in medicine, automotive repair, or solar panel installation. An object is always an object and a data type is always a data type. The person making the observations would be looking for breakdowns in the ability of the participant to comfortably complete a task without expressing some predetermined level of frustration. They, as an ethnographer, would be looking for patterns in behavioral occurrence, rather than numerical analysis of some laboratory constrained variable.
For qualitative insight, the program could mark video recording times when they complete tasks as prompted by recordings of their voice asking them to explain what they were trying to accomplish while using the interface and whether they prefer using voice or hands to control reality.
// Experimental Design
The first and foremost metric to evaluate the tool would be by systematically and categorically asking if the system worked, was used, and how the humans felt about it. This can be done with relatively few people and though derides the entire concept of lab based scientific inquiry, it might lead to ‘aha’ moments that a series of expensive measurements might not uncover. It can be accomplished with pencil and paper with anyone trained in ethnography.
Sometimes watching a single bird for 4 seconds at a lake is better than catching a bird and putting them under a microscope for 4 years in a lab.

Once major issues are discovered, they can be explored in a more nuanced methodology to verify the phenomena as the software application is built. For instance, if an ethnographer observes the headset wearers are mostly displaying despondent countenances from then they can be asked what they are trying to accomplish. It might be that 7 of 8 subjects say they are trying to open the training application with their voice but that wind seems to be overpowering this action. Then the ethnographer can recommend the modality versus tool outcome be analyzed.
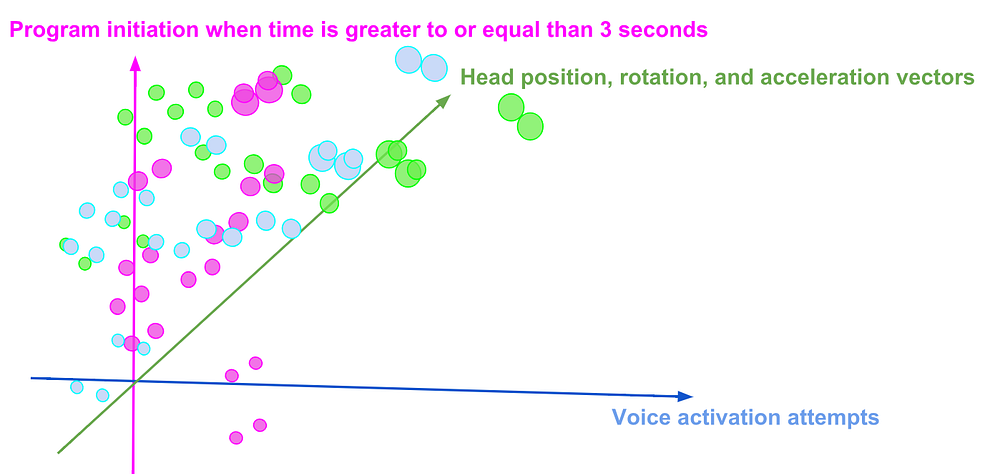
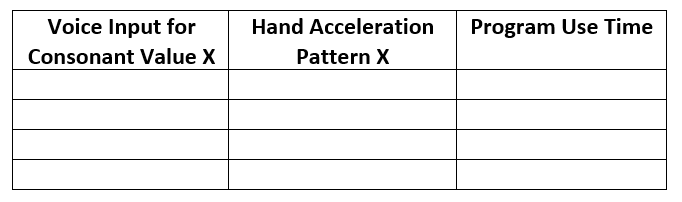
Assessing the effectiveness of headset quantitatively might be done with a simple machine learning algorithm that analyzes scatter plots for patterns in voice activation, hand movement attempts and program utilization.
// What next?
Ultimately, NASA decided not to solicit the c.14 Planetary Science Through Analog Research this year. This was heartbreaking. But I press on. The goal is to continue exciting people with this idea until someone says ‘wait…that might work’! I have fulfilled step 2 of my personal challenge in ‘Let’s light up the world!’ article. I actually submitted a letter of intent to NASA through their NSPIRES portal. Now I will visit a local high school in Denver this fall and show them the technology.
NASA will release a similar grant next year on February 14th. The hope stays ignited!
Special Thanks: Berlin and its inspiring coffee shops, oatmilk, and creative spaces in which to write this article.

References
[1] Collections d’histoires des sciences, Ville de Genève
[2] M. Tinklepaugh, “Storm Damage Assessment: Using Augmented and Mixed Reality” (Electric Power Research Institute, 2017).
[3] Overview for Reality computing in Aerospace and Electric Power https://www.epri.com/#/pages/product/000000003002014308/?lang=en
[4] https://devcenter.metavision.com/design/spatial-interface-design-principles-introduction
Image Information.
Image 1: SRC Reality Computing for Research in Energy and Space Exploration, Matt Oakley
https://www.epri.com/#/pages/product/000000003002014308/?lang=en
La Stereoscopie, Images captured by Micah Tinklepaugh
- Daguerreotype. Cuivre, argent, Bonijol, Geneve, seconde moitie du 19 siecle MHS inv 2484. Ce daguerreotype representant un portrait de femme est signe Louis Bonijol, unconstructeur genevois d’instruments scientifiqus.
- Stereoscope et prises de vue stereoscopiques Bois, verre, 19 siecle MHS inv. 2581. Sterescope portratif destine a visualized des prises de vue stereoscopiques en carton.
- Acier, laitron, Thury & Amey, Geneve, fin 19 siecle MHS inv. 2521. A la fin du 19 siecle, l’enterprise genevoise Thury & Amey met au point un obturateur rapide, dit instante, dont le temps d’exposition au 1/50 de seconde permettait de photographier des sujets en mouvement. L’obturateur se place devant l’objectif. Il est constitue de deux lamesentrainees par une cremaillere qui se croisent en sens contraire.
- Acier, bakelite, verre, Gaumant & Cie, Zeiss, Paris, def at 20th siecle MH inv 928. Appareil a double lentille, viseur et niveau d’eau. Avant glage des distances et temps de pose. Les prises de vues se laisaient sur plaques interchangeables.
- Stereoscope et plaques en verre stereoscopiques. Bois, verre, Ernemann, Dresde, debut 20th siecle. MHS inv. 2332. Appareil pour visualiser des plaques en verre stereoscopiques.
Des oiseaux en trois deminesions.
Copied from the plaque in the Collections d’histoires des sciences, Ville de Genève.
Placez vos yeux devant les deus oculairs et faites defiler les differentes photographies en tourrant les boutons en bois situes sur les cotes de l’appareil. Les oiseau et les oeufs d’oiseaux semblent apparaitre en relief. Ce type d’appareils permet de reproduire une image en trois dimensions. Inventee en Angleterre vers 1832, la stereoscope consiste a photographie un meme object sous deus angles legerement different. Les deus images sont projetess dans l’appareil de maniere a ce que chacune d’entre elles ne puisse etre vue que par loeil correspondant (l’image gauche est reflechie dans l’oeil gauche et l’image droite dans l’oeil droite). Lorsque l’on regarde simultanement les deux images, elles semblent fusionner et donnent un illusion de profoundeur.
Astronaut, Worker, SpaceX astronaut outlines Graphic: Micah Tinklepaugh
Figure x: Micah Tinklepaugh (by mixing an image by Alia Gurtov from pixabay and a silhouette of the ISS with a drop shadow I added.)
Stereogram watercolor wireframes: Original artwork by Micah Tinklepaugh
3rd Person and 1st person juxtaposition: Micah Tinklepaugh (with screen grab of Duke Energy Reticle on youtube)
Formative Prototype on Meta 2: Micah Tinklepaugh
Actual Stereogram, Micah Tinklepaugh
3D Scatterplot, Micah Tinklepaugh
Image of Berlin, Micah Tinklepaugh
Featured photo by Drew Graham on Unsplash


