


Mexico City’s voracious appetite for music streaming leads a pack of “trigger cities” sparking hits all over the globe. (Photo by Filip Gielda)
Streaming Popularity Starts Where You Might Least Expect
[Trigger Cities Mini-Series, Part 1]
Where do you make most of your money in the streaming world? And by “where”, we don’t mean Spotify, Apple, YouTube or any single platform….but geographically where?
More than likely, it’s North America, Western Europe, Brazil, the Nordic region, and/or Australia. Myriad factors go into that: technology & royalty infrastructure, mobile data costs, smartphone adoption, GDP, revenue per user, market penetration rates, population size, copyright legislature and enforcement to name a few.
But what leads to your bottom line? Virality, of course. That damn buzzword.
Doesn’t matter if you’re talking about TikTok or artists starting their own podcasts or artists coding their own social media auto-reply bots to emulate personality-accurate responses to each commenter on all their platforms (someone’s doing that, right?) We want eyes and ears, and we’re competing against Netflix, YouTubers, Instagrammers, Twitchers and Kindles.
“We all ‘live in a city called the attention economy.’”
— TechCrunch’s Andrew Keen, quoting ex-Google Design Ethicist Tristan Harris
In the streaming world, the spotlight shines on a select few, and for that blessed bunch, the light is blindingly lucrative. Whether it’s from an established superstar or emerging artist, the game gets so granular that attention ultimately comes down to a track-by-track basis.
At that track-level, your bottom line may get fattened by a set of countries with more wealth per capita, but how they get there may come from a completely different place.

Platforms want content that draws and retains active users to their app, and ideally, make subscribers out of them. Platform algorithms raise high-performing tracks to the top of the pile, and are all- to varying degrees- global and location-agnostic.
Silos of music consumption- formerly outlined by national economies, cultural/regional tastes, language and old-school media formats- are rapidly becoming a thing of the past. What an Indonesian hipster finds for free on SoundCloud might soon be played by a Spotify Premium for Family teenage user in Iowa next week. Maybe the same day.
While this idea is not new (MIDiA’s Mark Mulligan wrote about this in 2017 and Chartmetric’s Chaz Jenkins was banging on about it a decade ago at Google Zeitgeist), we’re operationally still getting used to it as an industry. To be fair: how easy could it possibly be to disseminate culturally-savvy and relevant content to hundreds of distinct cultures around the world? So the global dynamic demands further review.
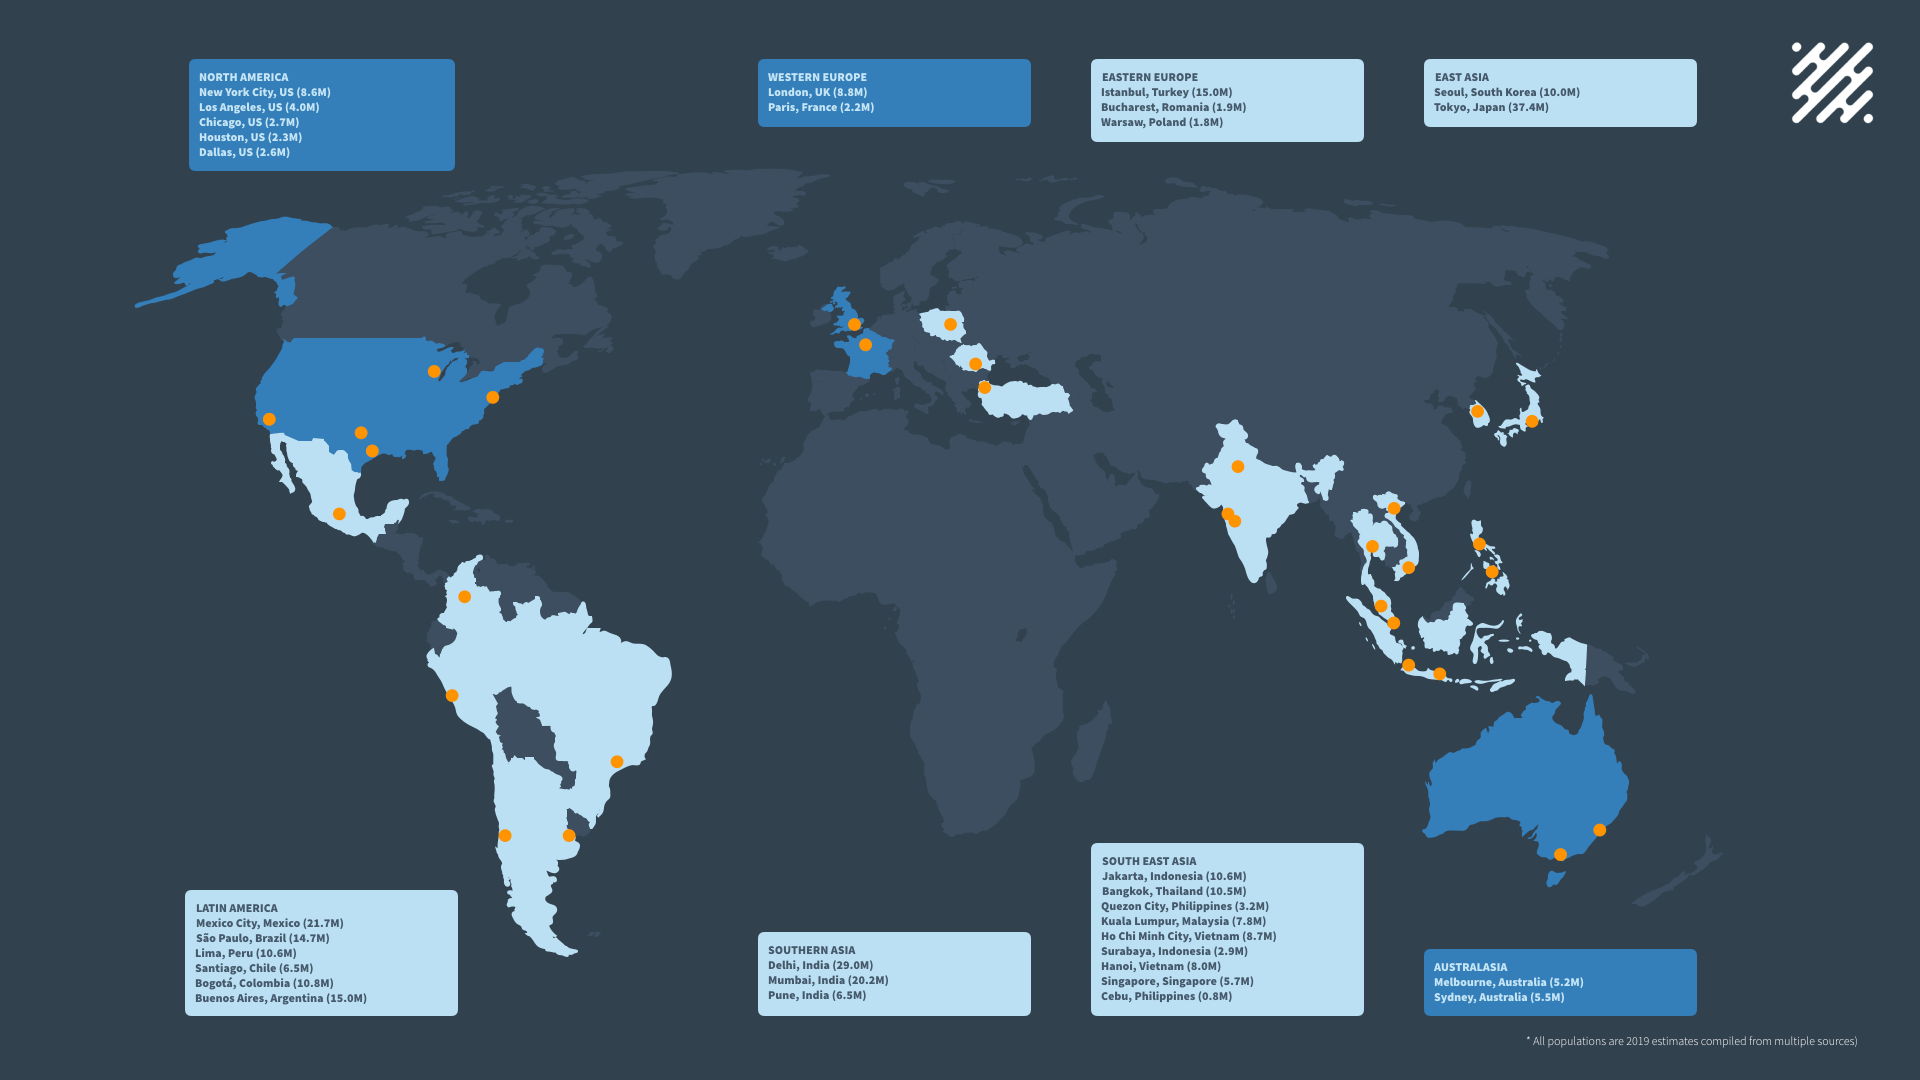
This origin of hype, or the ripple beginnings of a streaming wave, is what we’d like to call a “trigger”. In certain places of the world, there are cities that due to their socioeconomics, may not be large contributors to the global streaming revenue pot that IFPI measures annually.
But (as far as we know), algorithms just care about plays. With the amount of streaming activity coming from some of these “trigger cities”, they may now hold more power than ever to influence the hits of tomorrow by pressing play on them today.
In 2018, Chartmetric’s Partner and Advisor, Chaz Jenkins, independently examined ~40 artists who “emerged” in Western markets during 2017 and 2018, and then compiled their top 5 Spotify cities and top 10 YouTube cities, giving each position a score. Most of the artists were from the US and UK, with a few Korean, Latin and European artists mixed in.
The primary finding was that a few artists were almost exclusively returning results in the US and/or UK. The majority, however, were far more global with few US or UK cities, even if the US or UK was their home market.
Jenkins’ takeaway was that Latin American and South/Southeast Asian “trigger cities” tended to engage with new or emerging artists more rapidly, irrespective of an artist’s home market. Substantial engagement in a trigger city would often be followed by rapid engagement in other such cities, eventually including the artist’s home market.
So, could you simply focus on the high cost-per-click or cost-per-thousand-impression social media ads in the US or UK? Tour exclusively in these territories to maximize your profit margins? You could.
But is there a back door?
// Trigger Cities at the City-Level (Spotify & YouTube)
How can we vet the trigger cities concept by looking at two of the world’s biggest music streaming platforms? If we take a look across our database of 1.5M+ artists, we’ve grouped aggregated non-unique Spotify Monthly Listeners (a proxy for measuring Spotify activity) and YouTube Views by city.
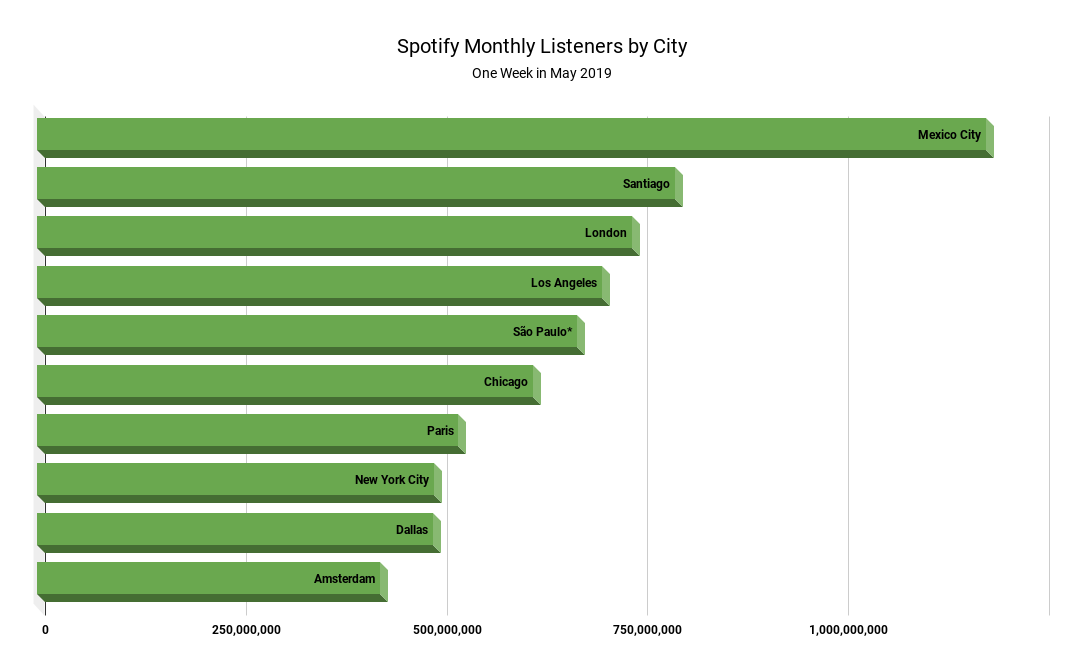
Spotify, being in 79 territories as of Feb 2019, shows a very Latin American, US/Western Europe-centric listenership. The Top 10 cities by non-unique Monthly Listeners include three Latin cities (Mexico City, Santiago and São Paulo), four American ones (Los Angeles, Chicago, NYC and Dallas) and three Western European ones (London, Paris and Amsterdam).
In Nov 2018, Spotify hailed Mexico City as the “World’s Music Streaming Mecca”, and the evidence is clear here. At 1.1B non-unique Monthly Listeners, it’s shown itself to have far and away the most Spotify activity across its artists, with Santiago coming in second at 793B.
[To clarify this admittedly weird stat, “non-unique Monthly Listeners” is our way of gauging a week’s worth of listening data by city, even though each day’s statistic is really a 28-day measurement….long story short, let’s just think of it as a recent, rough way to rank a city’s streaming activity, not actual people.]
*São Paulo, though listed here in 5th place, is really in 3rd, as “Sao Paulo” comes up as a separate city (we love metadata) with 101M Monthly Listeners, and thus bringing their week’s listenership to 772M, and past London (739M).
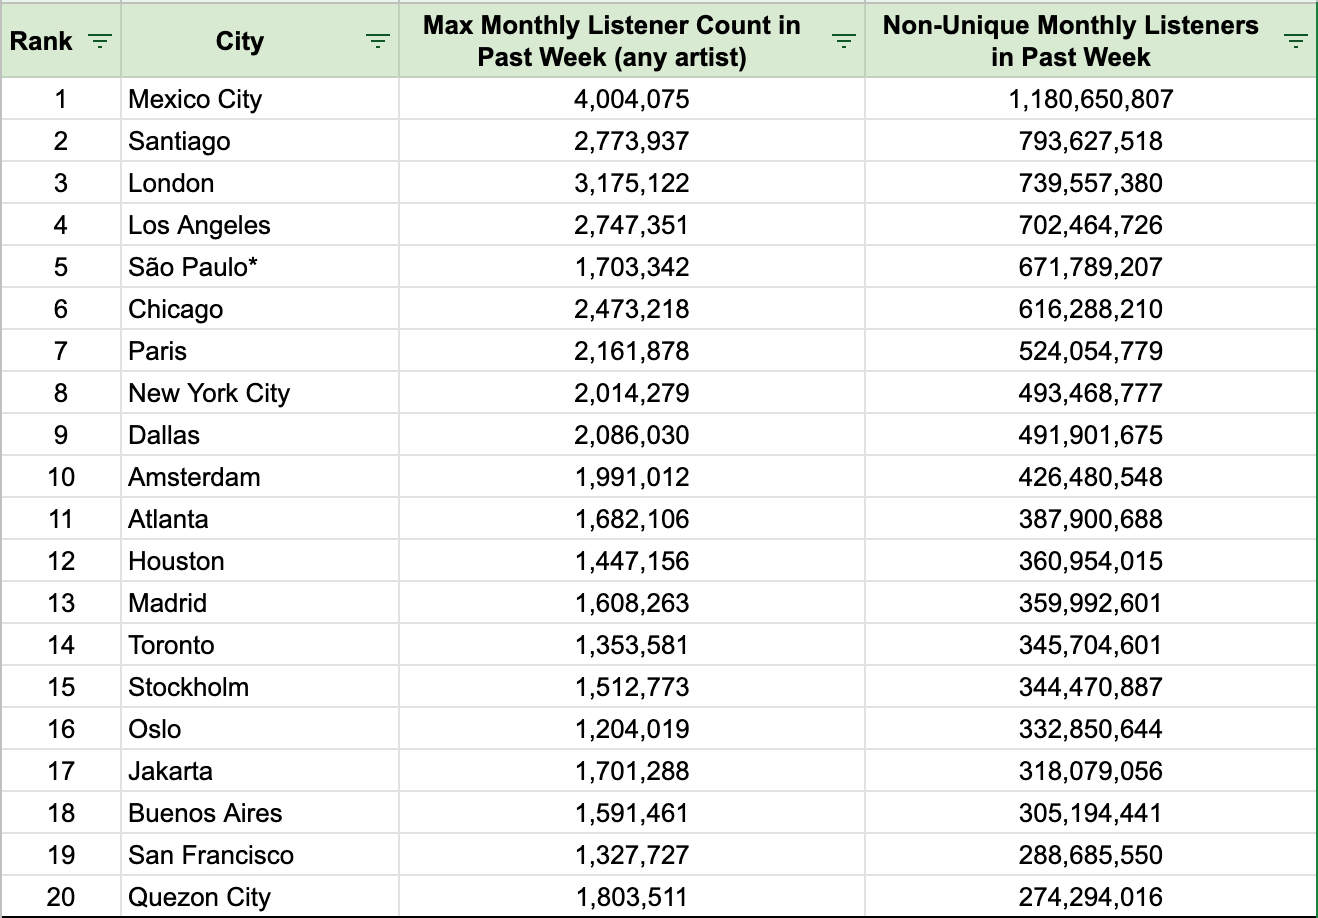
From cities 11–20, we see more of North America (Atlanta, Houston, Toronto, San Francisco), Latin America (Buenos Aires) and Europe (Amsterdam, Madrid, Stockholm, Oslo), but also the beginnings of Southeast Asia (Jakarta and Quezon City), and more hints of the “trigger cities” concept.
If we turn to YouTube, which is a much more accessible streaming platform due to its controversial “value gap” licensing freedoms, the biggest of all at 1.9B users worldwide (this is 8.5x Spotify’s) and able to provide a more direct usage metric (YouTube views), we begin to see trigger cities in a much bolder form.
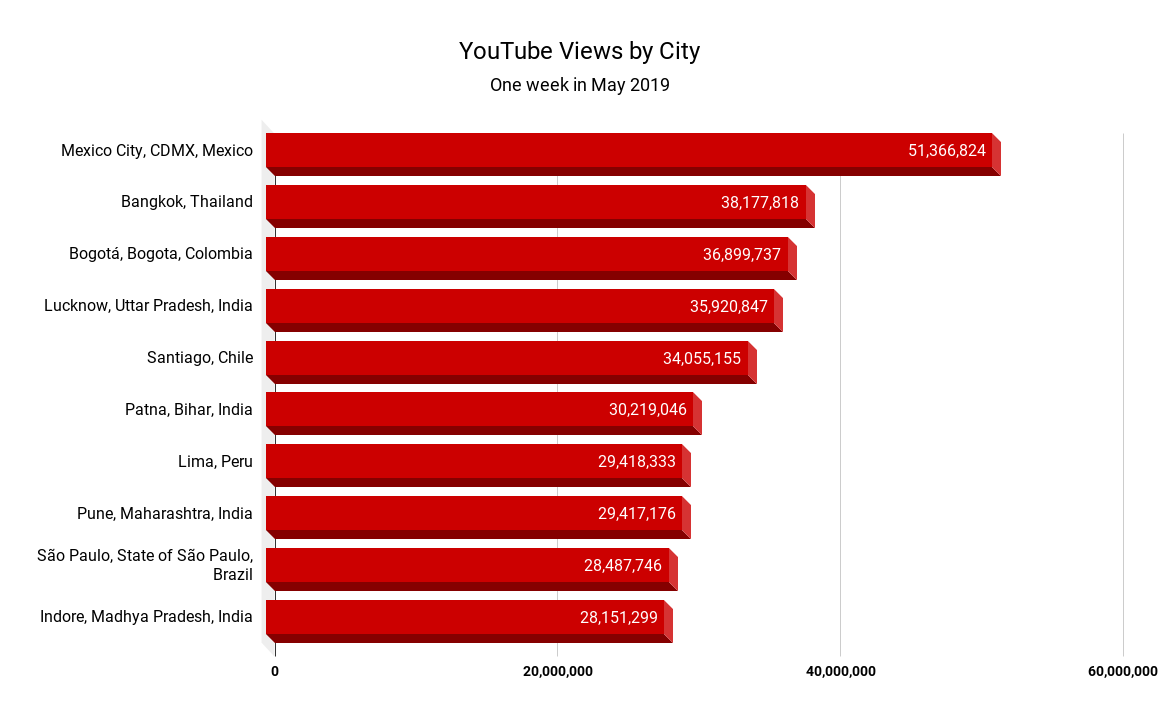
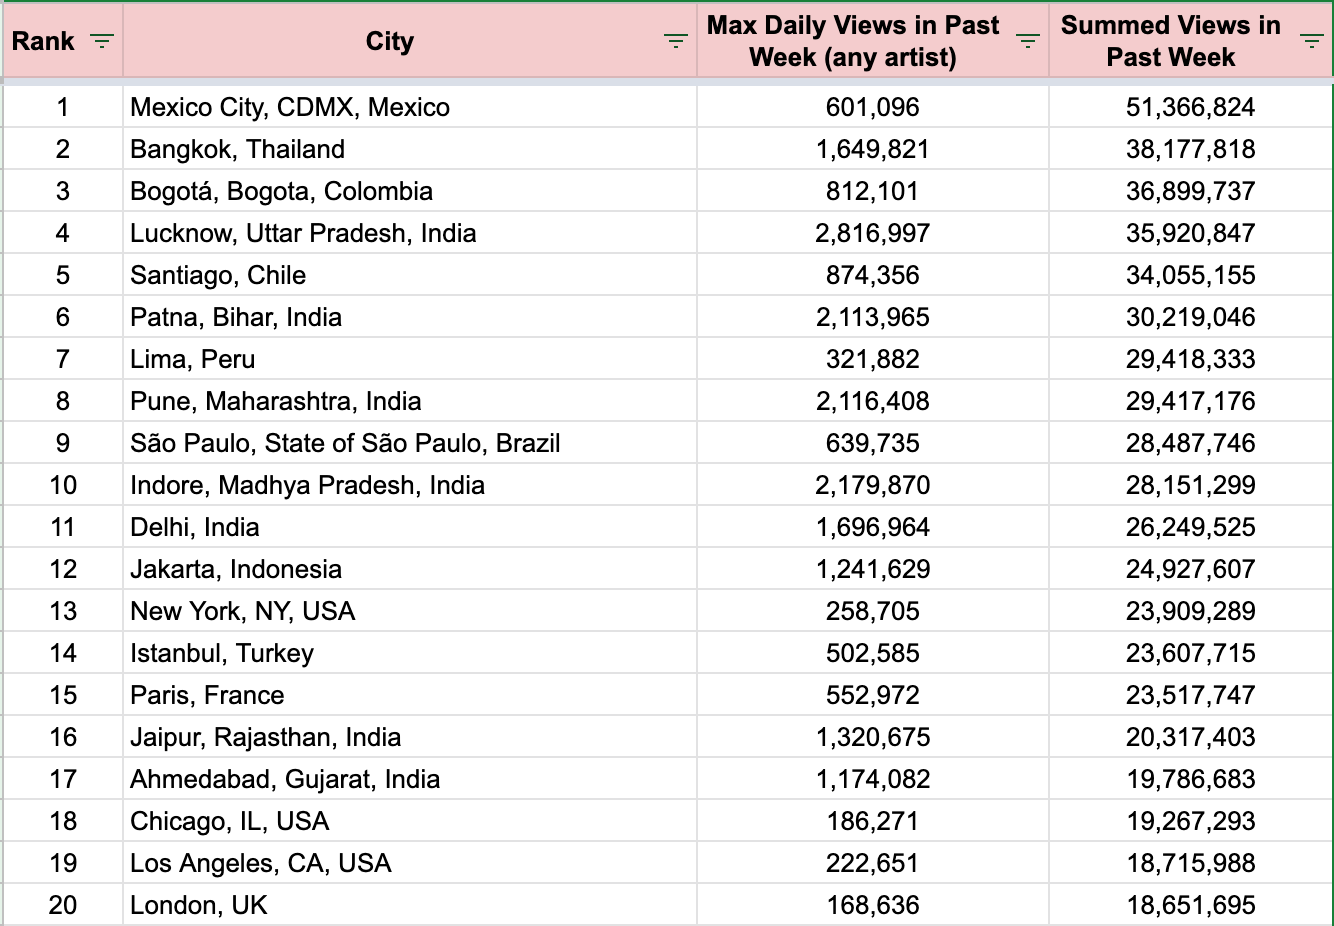
Aggregating all of our YouTube views by city across our 1.5M+ artists in the past week, Mexico City, once again, turns up in the #1 spot by good measure at 51.3M, but that’s where the similarities with Spotify end.
[Note that these YouTube views by City, are indeed that, and not a proxy measurement for app activity like for Spotify above.]
At 38M views, Bangkok sits in the #2 spot, with four Indian cities (Lucknow-#4, Patna-#6, Pune-#8 and Indore-#10) also occupying the YouTube Top 10. Latin America claims another four cities (Bogotá, Santiago, Lima and São Paulo), completing a shutout of any US or western European territories.
As a matter of fact, New York City at #13 (23M) is the first city from the US or western Europe to appear at all, with only Paris (#15–23M), Chicago (#18–19M), Los Angeles (#19–18M) and London (#20–18M) rounding out the top 20 cities. Indian, Indonesian and Turkish cities take the rest.
A fair argument to be made here is that depending on the platform, many of these cities are somewhat siloed still by content: how likely is it for a Lil Nas X track to resonate meaningfully in Bangkok or a J Balvin track be played strongly in Lucknow, India? Access alone does not mean cultures instantly forget their local preferences in language, attitude and so on.

But what is “meaningfully”? Due to sheer population size and/or heavier streaming activity per capita, a mere percentage of one of these lesser known trigger cities, to a single Western artist, can be worth more than all the streaming activity of a higher-profile city that they’re throwing all of their marketing spend at.
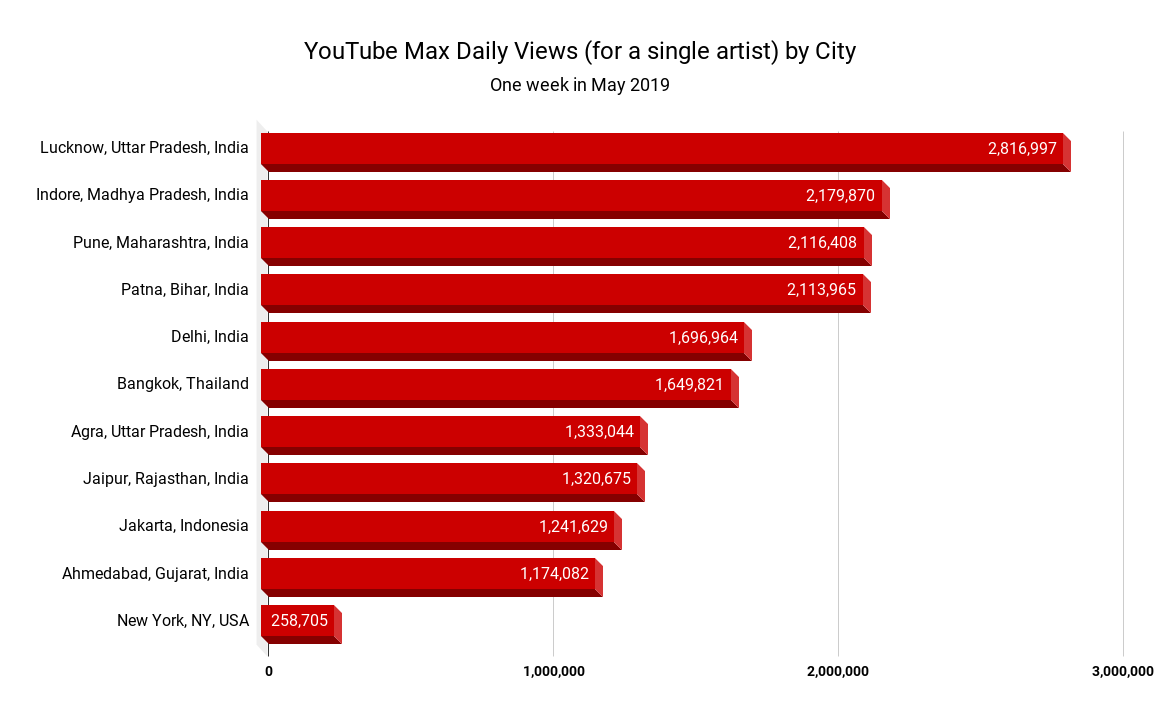
For example, Bangkok in the past week viewed their favorite artist 1.6M times on YouTube, while in NYC, they maxed out on their favorite artist at 258K views (see chart above). Chances are if you’re a Western artist manager, you’ve spent more in the past week on YouTube ads targeting New Yorkers, when you only need be 1/6 times as successful in Bangkok (as well as at a much lower ad cost rate), but have gotten just as many plays.
There is no need to explain with India, whose eight cities dominate the Top 10 YouTube Max Daily Views chart. It’s clear as day the kind of YouTube growth that lay in store for any single artist able to harness that kind of streaming power. Is it any surprise that Indian YouTube channel T-Series defeated the former YouTube subscriber king?

// Trigger Cities at the Track-Level
To kick the tires on the trigger city concept at the track-level, let’s examine American singer-songwriter Lauv, former New York University Music Business student and current pop staple with 2.5B+ worldwide streams under his belt.
As an independent artist, his hit “I Like Me Better” released in May 2017, but without a cozy Today’s Top Hits debut like only a handful of epic-level artists enjoy. Instead, the track enjoyed a much more organic (and what seems to be algorithmically-driven) playlist life. It’s with a great pop song from an emerging artist like this where we have a better chance of seeing the trigger cities concept in action.
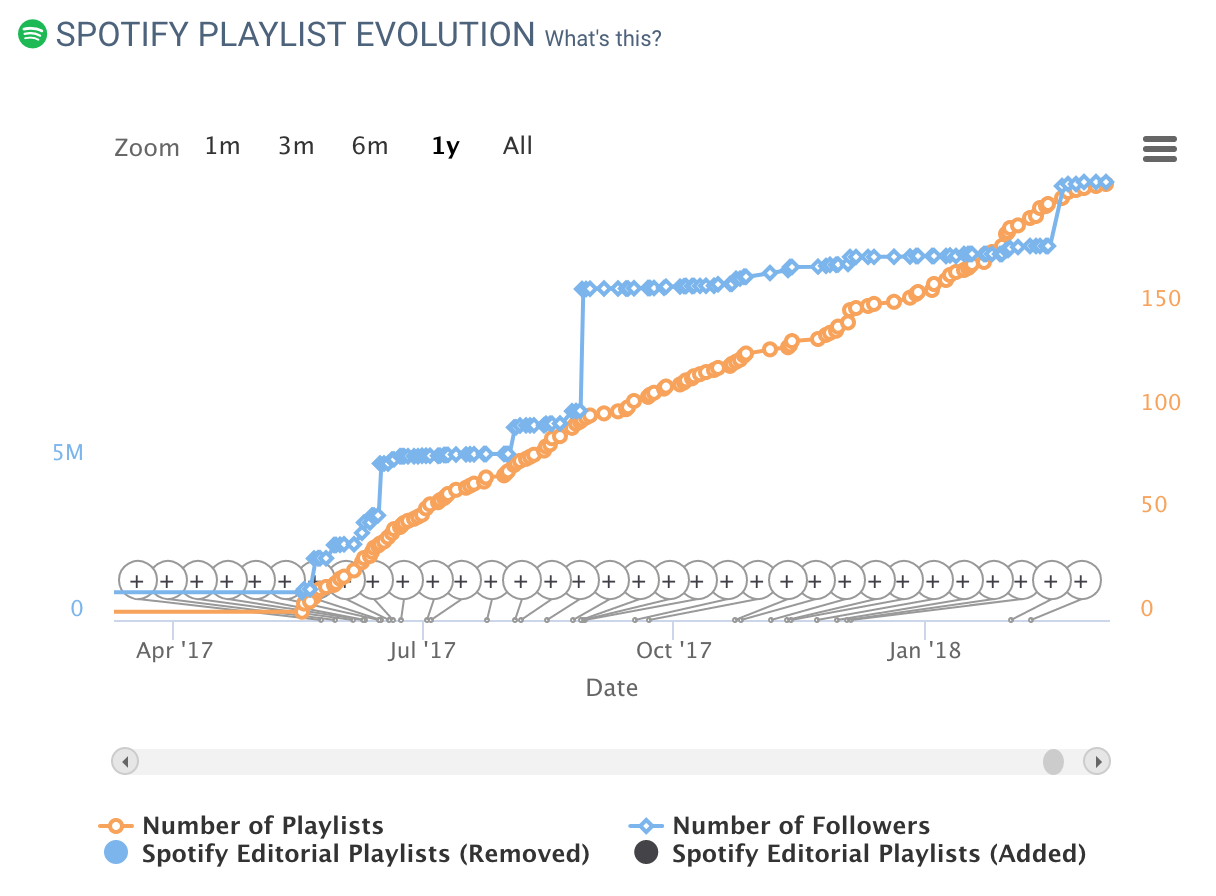
Looking purely at Spotify editorial playlists in its first month after its release date (May 19th), the moves up the playlist hierarchy are:
- DAY 2: The first signal comes from Spotify Malaysia’s “It’s A Hit” playlist (1.9M followers), placing the record in a low-key 45/50 position.
- DAY 4: Brazil-focused “FrienDeSemana” playlist (985K followers) picked it up two more days later (5/23) at a 16/50 track position.
- DAY 6: “Top Hits Philippines” (3.2M followers) premieres the track in a 10/50 position.
- DAY 11: Spotify drown-proofs the record by leading it (1/90 position) on the track’s first context-based playlist, “Evening Commute” (426K followers).
- DAY 21: Indonesia-focused “Hits Banget” playlist (309K followers) debuts in a low spot at 64/68 position.
- DAY 22: Spotify’s frontline-focused “Everyday Favorites” (335K followers) is the track’s first content-based playlist, placing it mid-pack at 34/69 position.
- DAY 27: “Top Hits Malaysia” (237K followers) follows suit.
- DAY 28: Spotify’s context-based “TGIF” playlist (1.6M followers) becomes the track’s first 1M+ follower playlist.
On August 18th 2018, a little over a year later, Lauv’s “I Like Me Better” eventually becomes a part of Spotify’s 6th most-followed playlist (8M) and most-followed context-based playlist overall, “Songs to Sing in the Car”. The 100-track, personalized, catalog-focused list is essentially the streaming platform’s rotating “Hall of Fame” for pop music.
Not a bad place to end up.

// Cultural Context = Confusion + An Opportunity
Is “I Like Me Better” a fringe, freak case? Possibly, though the trigger cities concept only means something to 1) a very talented artist 2) who’s still establishing a public reputation 3) with a great track to boot and 4) given an “organic”, algorithmic distribution strategy. You can argue this combination is already a rarity. Cardi B and Drake have no need for such a strategy, and neither does a new artist who doesn’t check all the above boxes. But when a playlist evolution like Lauv’s occurs, it’s hard to ignore the aggregated city streaming statistics we observed earlier.
The effect of genre is also huge: a Spanish-language Latin hit surely will resonate in Latin America, but does that necessarily crossover into the US? Would hard-hitting rap hits work as well in conservative Southeast Asia? Does the EDM club banger with no words have a better chance of international success? These are all questions that deserve a more rigorous, data-science intensive approach for such a premise to really be vetted properly.
Most importantly: who are these people? The unfortunate side effect of global statistics like monthly listeners and views is that a number is just a number, and from the business perspective, of course all we want is that number to go up.
But despite us being in a cultural industry, it can be very easy to forget the various cultural contexts our music ends up in. For example, Masaki Yuki in Social Psychology Quarterly argues that in East Asia, there is a very conscious, well-defined social intragroup structure called “East Asian collectivism” that opposes the Western intergroup structure called “social identity theory”.
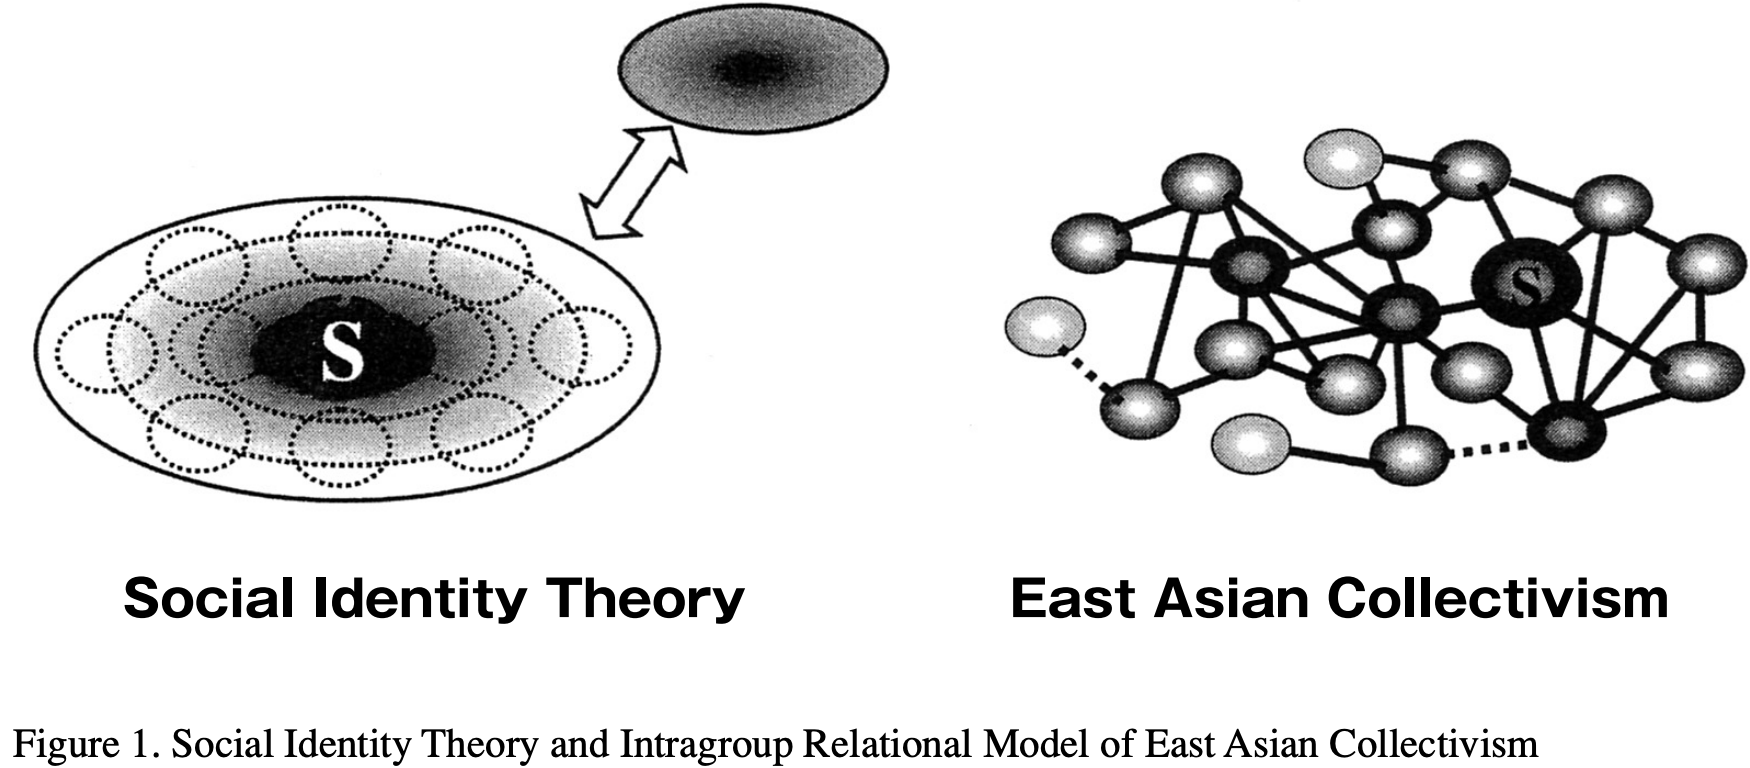
Essentially, he found Westerners tend to self-identify with a certain in-group (e.g., hipsters, punks, jazz enthusiasts) and otherwise view themselves as interchangeable with other in-group members, only contrasting their in-group status with outsiders. Or, “I’m an *NSync fan and love being at concerts with fellow fans…but eww, why would we ever listen to Backstreet Boys? Boo! *NSync 4eva!”
Meanwhile, Yuki concluded East Asians would self-identify as part of a specific in-group (e.g., a K-pop fandom), view themselves as unique nodes that exist within a clear hierarchy, and paid less mind to out-groups. Or, “Beom-seok is my favorite singer in the group, but I’m still a new fan in my first year…I should listen more to Hyo-joo, who has a Do-hyun bias and is the most experienced fan in my group chat and always finds the latest news for us…I should try to impress the newest member Ji-hye so I can impress Hyo-joo…I guess there are other fandoms to join, but don’t really care right now.”
These types of cultural contexts must affect how trigger cities stream and share music, and therefore affect what we do. Stay tuned for a deeper dive into this paradigm, as we will dive into trigger cities on a regional and city-level basis, digging into the nuts and bolts that affect our industry more and more. With some global awareness, we can hopefully get the right music to its potential fans in a way that makes more sense to them…and hopefully more cents for artists.


