


MEASURING FAN ENGAGEMENT OF YOUR FAVORITE HIP-HOP ARTISTS
Research/Writing by Gillian Robins | Analysis/Writing by Jason Joven
Rap and hip-hop have deep roots in social activism, from rebel rap group N.W.A. to the mercurial Tupac Shakur. Whether it was Chuck D showing us how to fight the powers that be, or Yasiin Bey (f.k.a. Mos Def) corresponding from Brooklyn’s Bed-Stuy streets, rap gave us a lens into American lives some of us knew nothing about. Of course, party rap tracks have their time and place, but “conscious rap” can cause you think differently or feel empathetically. Some of our greatest rappers chose to be a voice to people who have faced injustice, been systematically disadvantaged, or simply just were down on their luck.
However, time passes, commercialization happens, and the product naturally changes. Rap artists now have platforms like YouTube and Twitter at their fingertips to broadcast their views and share music and visuals, but a fan is more likely to see a fun selfie or dance meme on a big artist’s feed, rather than a deep-seated social statement.
So with the precarious state of politics and momentous movements like #metoo and #blacklivesmatter growing, we’re wondering from a data perspective: do rap fans care about social activism?
Using a case study approach, let’s take a look at Chartmetric’s data on three of 2018’s biggest names in the game who are not afraid of such difficult issues: Childish Gambino, Kendrick Lamar, and Logic.
What are the signals we see from these artists when they put out “dangerous” material? Are there any? If so, is it platform-specific or across the board? For once, we use the artists’ data to turn the spotlight on the audience itself, and how they engage with socially conscious material.
Childish Gambino // This Is America
Unless you’ve sworn off the Internet for the past couple months (good for you), chances are you came across Childish Gambino- the musical moniker for screenwriter/producer/actor Donald Glover (known for his comedic role in NBC sitcom Community and Emmy-winning FX series Atlanta). If so, it was most definitely for his viral video This Is America, released on May 5, 2018.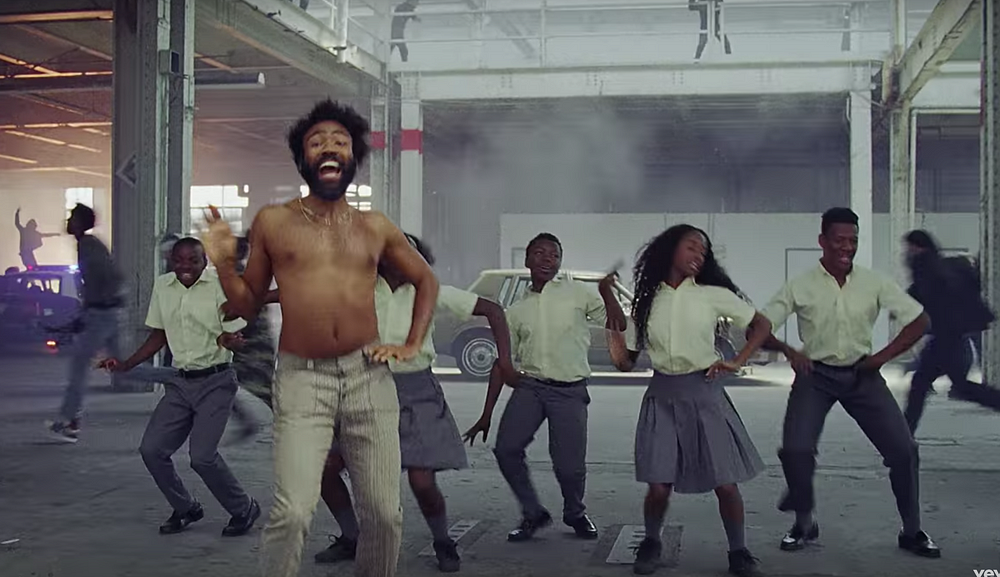
For those who have not seen the imagery-rich video, it features a shirtless & scruffy Glover, surrounded by a group of sprightly teenagers in school uniform, bopping about as Glover — while rapping — commits gruesome acts and chaos ensues around them. Some lyrics are caustic, like “you just a black man in this world / You just a barcode, ayy”, while others are meant to satirize 2018’s popular trap artists. It’s hard not to miss the message that Glover is conveying: America is filled with violence and injustice, but we’re all too busy with pointless Internet memes and our smartphones to really do anything about it.
Immediately upon its May release, This Is America’s signals were quite clear across all Chartmetric charts (even SoundCloud, usually known for underground music), and though the lyrics themselves can be subversive, they can also be relatively breezy and carefree:
I know you wanna party (yeah) / Party just for free (yeah) / Girl, you got me dancin’ (girl, you got me dancin’, yeah) / Dance and shake the frame (ooh) — via Genius
With the upload that launched a thousand reaction videos, it was Glover’s visual prowess (enlisting Atlanta director Hiro Murai for the music video) that truly brought it to its cultural peak, rather than its lyrical content. Naturally, there was a very strong signal on YouTube.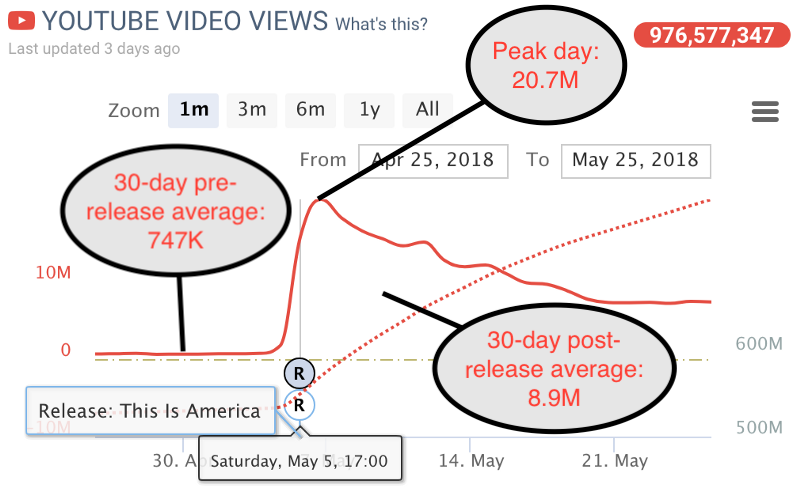
For the month prior to the video’s release, Gambino averaged ~747K daily YouTube views. After, his views spiked to 20.7M (~2500% lift), and even two months later, still was seeing average daily views well over 2M (~90% lift).
A strong peak, followed by an inevitable decline at a certain rate, can be used as a basis with which we can loosely measure the resonance of a release/announcement/public appearance or other notable artist event that we’ll call event decay:
Event Decay = (Peak value — 30-day average before release) /(Peak value — 30-day average after release)
The idea is an artist doing something awesome will show a slower decline in fan engagement than something that is relatively forgettable. Then, a third element of how high the peak is relative to their norms is also included to keep its initial impact in perspective.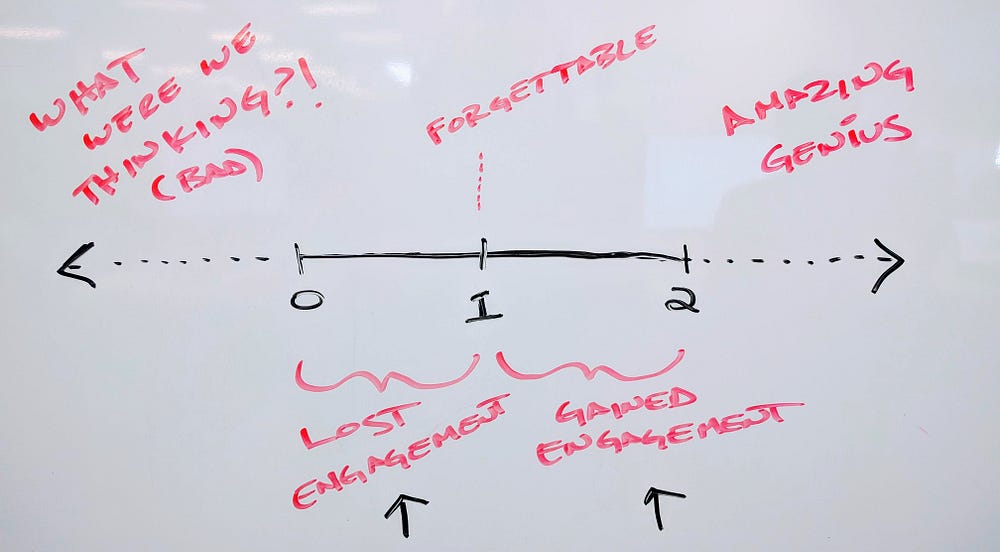
A perfect 1.0 means that whatever happened was likely a drop in the bucket, for all intents and purposes. Maybe it was a great marketing/promotion campaign you put on to spark that initial peak, but it probably didn’t change culture forever. It’s OK, there only be so many Bohemian Rhapsodies in this world. Back to the drawing board.
Significantly lower than 1 means that what happened may have decreased fan engagement, and significantly higher than 1 means that the event may have increased it.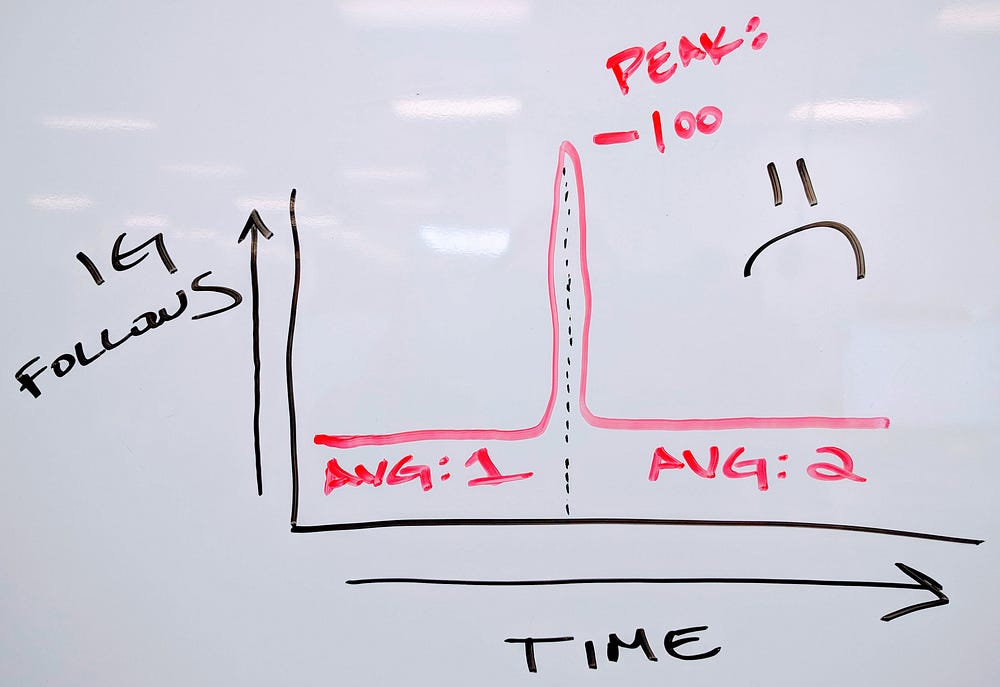
For example: if you averaged 1 Instagram daily follower, did something super cool that got you 100 followers, then averaged 2 daily followers…that super cool event gets a 1.01 decay…ho hum.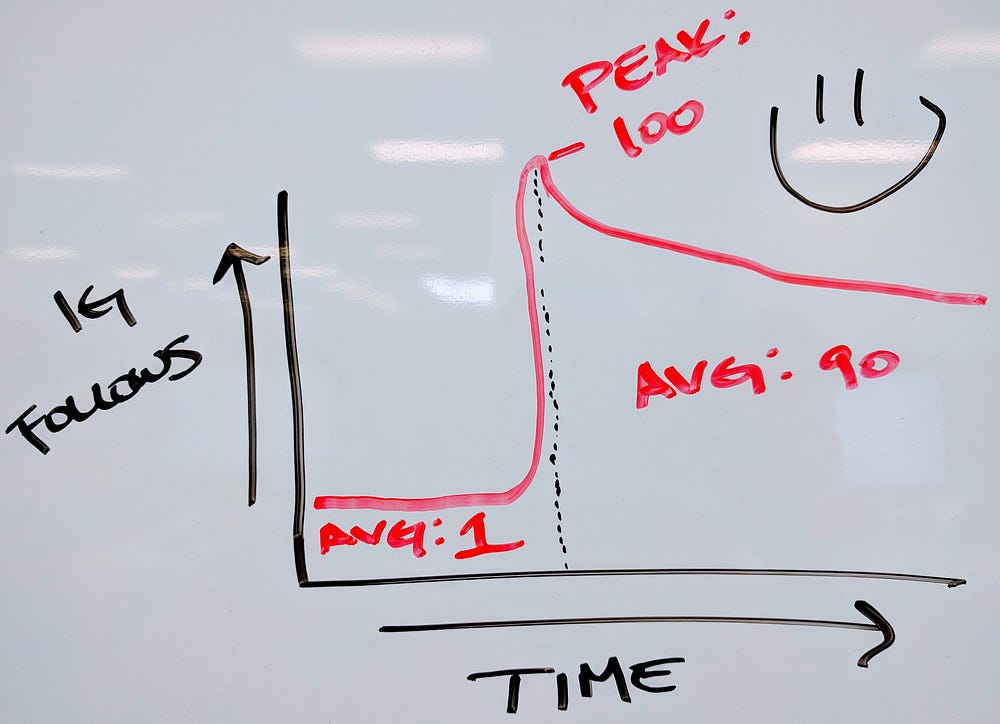
But if instead you averaged 90 daily followers post-event, then you must have dropped some fire and it gets a 9.9 decay. Whatever you did, it’s resonating.
We now can use this for virtually any chronological chart you see on Chartmetric, and can modify the time horizon, depending on the situation. If you’re looking to drill down to a 7-day decay to maybe measure a more acute effect of a recent release, for example, you can certainly do so. It risks a more noisy signal, since there’s fewer days to sample, but maybe in your situation it can still be useful. Let’s apply this to Childish (see previous YouTube insert for values):
Event Decay (30) = (20.7M–747K) / 20.7M–8.9M) = 1.7
So This Is America definitely made its mark, and if we tried its 45-day decay?
Event Decay (45) = (20.7M–758K) / 20.7M–7.6M) = 1.5
On the 45th day after release (June 20 2018), Childish had 3.7M views alone (390% lift), way more than his pre-release daily average. Quite impressive.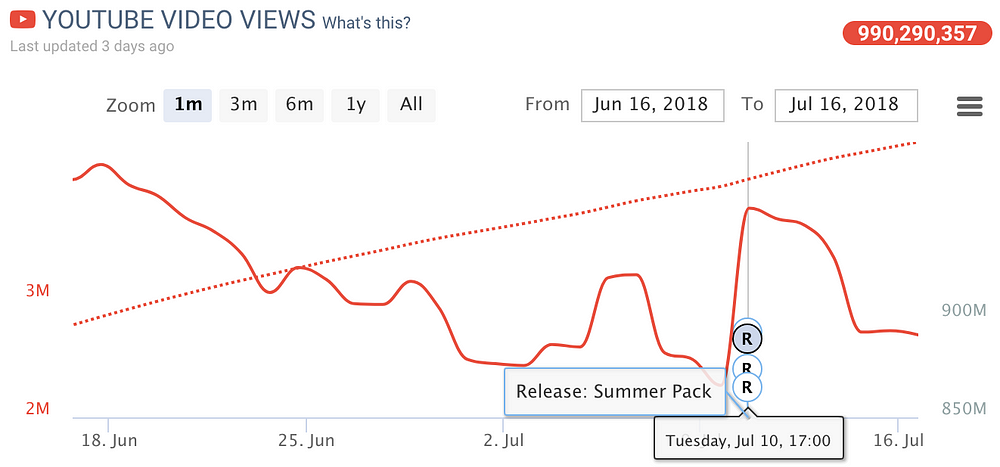
Compare that to his most recent July 10 2018 release, Summer Pack, a 2-track EP with catchy but relatively benign summer songs. It has yet to have even a full week of activity, and therefore we can’t muster a meaningful event decay.
Childish Gambino’s post-This Is America release: summery, easy vibes in July 2018.
But This Is America already had 20M views within a couple of days, whereas Summer Pack has had a viewership of 3.7M+ in its first week- healthy, though nowhere as viral as its predecessor. Its event decay would likely reflect this.
For now, Summer Pack just features static cover art video, which makes it less visually engaging…but for Mr. Glover, it’s a music video break well-earned.
Kendrick Lamar // 2018 Grammy performance
Both a top critic’s choice and a Grammy-winning and Billboard-topping commercial success, Kendrick Lamar is widely revered as a strong, cerebral artist both visually and musically. The first non-jazz/classical artist to win the Pulitzer Prize for Music and considered by many to be today’s antidote to the “mumble rap” phenomenon, when K.Dot speaks through his lyrics, people listen.
“I just wanted to remind the audience that the only thing more frightening than watching a black man be honest in America…is being an honest black man in America.” — Dave Chappelle, during Kendrick Lamar’s Jan 2018 Grammy performance
By 2018, Lamar had made a tradition of raw, politically-charged award performances from 2015’s BET Awards (from atop a vandalized police car) to 2016’s Grammys (entering stage in prison chains) to 2017’s MTV Video Music Awards (replaying Fox News’ clip of how hip-hop has “done damage” to America’s youth, with a man lit afire). So by the time his Jan 28, 2018 Grammys performance came around, it would be safe to say the Lamar would not be playing cartoons.
Kung-Fu Kenny (aka Kendrick Lamar) doing what he does best at the 2018 Grammys
Instead of looking at his YouTube presence for a socially conscious signal (very likely inflated due to Marvel Studio’s gargantuan Black Panther soundtrack release in Feb 2018), let’s take a look at one of Chartmetric’s less obvious data sources: Wikipedia.
The unique advantage Wikipedia has over all the other music/entertainment-centric data sources we have is that it’s less sensitive to the vagaries of pop culture. One of the confounding variables in streaming, for example, is the weekend phenomenon that we explored in our CNCO/Latin boy band piece back in Dec 2017: the very obvious but somewhat unpredictable bump music artists get on Fridays and Saturdays.
Wikipedia seems to be a great barometer for pure artist curiosity. It has no paywall, no ads, it’s freely accessible to anyone with an Internet connection (though language version would introduce geographic complications). There’s no music or video to play on those blank, white pages…no button to tap on your phone to give yourself a geo-located selfie concert sticker to send to your friends to give them FOMO.
When you have what’s likely unfamiliar listeners enticed to learn more about the person…isn’t that marketing gold? Alternatively, it could also measure new audience reach for a specific promotion you may have ran at the time. Either way, we at Chartmetric believe there’s real value there.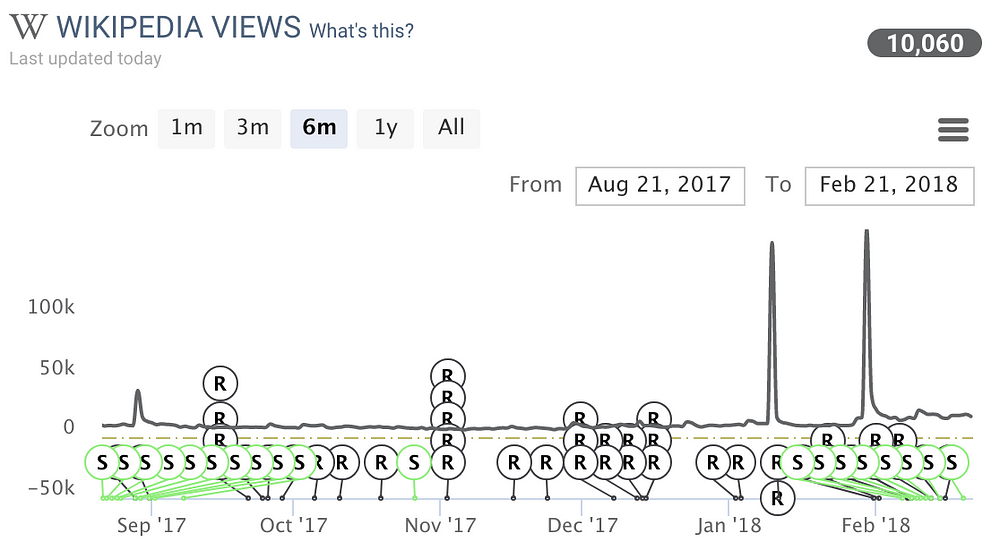
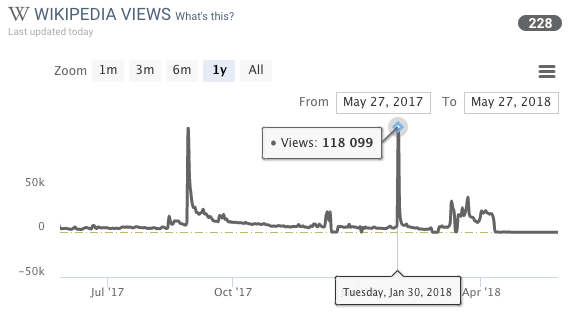
First, notice the calm signal Wikipedia yields when the artist is relatively inactive, making it quite easy to see what pops out. In Lamar’s case, they occur when he makes a socially-charged statement- what his reputation is all about.
The first spike signal you see for his Aug 27 2017 MTV VMA Awards performance yielded a 30-day event decay of 0.94, meaning it’s almost like he did nothing (maybe this is more of a statement of MTV’s decreasing exposure than anything else).
The second is from the Jan 8 2018 College Football Playoff National Championship, where interestingly, President Trump was in attendance and Lamar (not a MAGA fan) was performing in the halftime show. The 30-day decay for this spike was 1.09, which also didn’t seem to yield much of a long-lasting effect. Maybe college football fans took a Wikipedia halftime beer break, but never got intrigued later in the week.
The third signal is from the Jan 28 2018 Grammy performance, which had a 30-day decay of 1.02…even with U2’s Bono/the Edge and Dave Chappelle pitching in to the performance.
Disappointed?? Me, too. These were huge artistic statements on very public platforms…but there’s still something to learn, and it’s about our data source, not the artist.
Wikipedia’s strength is showing unfamiliar audience reach, but its weakness seems to be “stickiness”, or repeated consumption, which makes more sense…why would you repeatedly return to see where an artist’s hometown is or what year they were born in? Once you know, you know.

All datasets have their quirks. It’s good to know what to use for what.
Logic performing “1–800…” with Alessia Cara & Khalid at the same 2018 Grammys as Kendrick Lamar
Logic // 2018 Grammy performance
With an unlikely breakout song colloquially known as “the suicide song”, Maryland-bred underground rapper Logic performed 1–800–273–8255 with artists Alessia Cara and Khalid on the same 2017 VMA MTV and 2018 Grammys awards shows that Kendrick Lamar performed at…but with noticeably “sticky” results.
The most important song I’ve ever wrote… pic.twitter.com/Lmfu9BnF31
— Bobby Biracial (@Logic301) July 12, 2017
Logic’s July 2017 tweet on Nat’l Suicide Prevention Hotline after effects
Its title also being the National Suicide Prevention Hotline phone number, the song’s main message is hope for those who are in a very dark place. Calls to the Hotline as well as social media/website engagement showed strong reactions after the the song’s initial release in April 2017 (see Logic’s tweet for the Hotline’s own analytics).
It should be noted that addressing widespread, socioeconomic issues like poverty, racism, and other forms of acute and systematic discrimination (Childish Gambino, Kendrick Lamar in this piece) and addressing a very internal, personal issue like suicide prevention (Logic, here) would have admittedly different effects on its listeners. So this should be taken into account when interpreting hard signals on Chartmetric.
Taking a look at Logic’s Spotify Follower and Popularity Index charts below, we definitely see strong reactions to the initial 2017 MTV VMA performance of 1–800. In case you’re not familiar with the Spotify Popularity Index (or SPI, Chartmetric FAQ here), it’s a Spotify-generated, normalized popularity index that runs from 0–100, and updated daily. It basically takes all artists on the platform, and ranks their popularity according to all the data native to Spotify.
How it is generated seems to be treated with national security-level secrecy, but we believe that monthly listeners, followers, playlist reach, library saves, and total streams are all major factors of it.
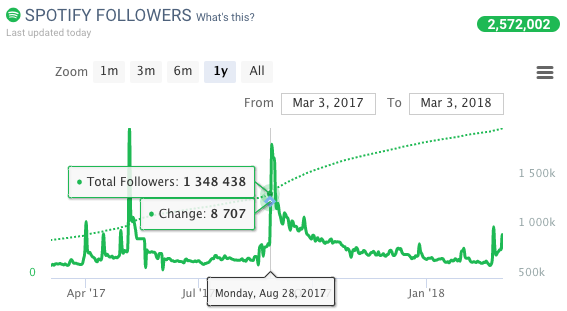
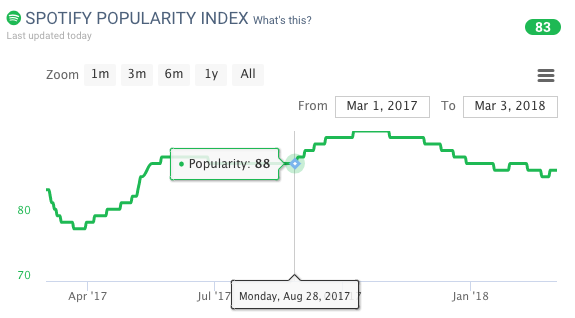
Logic’s first Followers spike you see at the beginning of May 2017 was due to his last studio album Everybody, which naturally show on both charts. We can simultaneously get a feel for how the SPI chart is rarely acute, and is more of a gentle slope.
With his 2017 VMA performance, Logic’s SPI maxes at 93, and we find his 30-day event decay for Spotify Follows to be an impressive 1.56, suggesting a strong after-effect of the deeply emotional appearance, which seems to corroborate the very real effects that the Suicide Hotline reported.
Coming back to our Wikipedia lens, we see rather unimpressive 30-day event decays of 1.13 and 1.00 for the VMA and repeat Grammy performances…but this helps us understand the data source better!
Given the obvious public and Logic-centric effect that 1–800 had along with the similarly benign event decays for Kendrick Lamar’s huge performances at the same events, it would be suggestive that our initial speculations on the pros and cons of Wikipedia are indeed true.
Don’t Believe the Hype…Measure It.
Big spikes of fan engagement are usually the result of hard work and creativity, so congratulations on that accomplishment! But after the dust settles, a real honest look at what is sticking to fans is what can give you lasting insights in how to delight them via social media posts, public appearances, or music releases you or your artist engages in.
Are you strong in making mind-blowing video content? Hopefully you’re checking out our Instagram and YouTube Views charts to monitor progress.
Are you making meaningful music and lyrics that encourage repeat streams on loop? There’s the Spotify Follower and SPI charts for that.
And in the case you’re politicking for a spot on a nationally-televised halftime show or awards show, now you’ve got a secret data source to do some research on: good old Wikipedia.
So next time you get a spike signal on a social media/streaming chart, try checking its event decay, even if it’s eye-balling the chart quickly…it’ll be more of a soft decline, rather than a singular, even-sided spike. Because no matter how high the one-day spike is, sometimes it might help to not believe the hype…measure it!
Public Enemy’s 1988 music video for “Don’t Believe the Hype”


